Chapter 5: Equation solving
Robert Johansson
Source code listings for Numerical Python - Scientific Computing and Data Science Applications with Numpy, SciPy and Matplotlib (ISBN 979-8-8688-0412-0).
%matplotlib inline
import matplotlib
import matplotlib.pyplot as plt

matplotlib.rcParams["mathtext.fontset"] = "stix"
matplotlib.rcParams["font.family"] = "serif"
matplotlib.rcParams["font.sans-serif"] = "stix"
from scipy import linalg as lafrom scipy import optimizeimport sympysympy.init_printing()import numpy as npimport matplotlib.pyplot as plt
%matplotlib inline
# import matplotlib as mpl
# mpl.rcParams["font.family"] = "serif"
# mpl.rcParams["font.size"] = "12"from __future__ import divisionLinear Algebra - Linear Equation Systems
fig, ax = plt.subplots(figsize=(8, 4))

x1 = np.linspace(-4, 2, 100)

x2_1 = (4 - 2 * x1) / 3
x2_2 = (3 - 5 * x1) / 4

ax.plot(x1, x2_1, "r", lw=2, label=r"$2x_1+3x_2-4=0$")
ax.plot(x1, x2_2, "b", lw=2, label=r"$5x_1+4x_2-3=0$")

A = np.array([[2, 3], [5, 4]])
b = np.array([4, 3])
x = la.solve(A, b)

ax.plot(x[0], x[1], "ko", lw=2)
ax.annotate(
    "The intersection point of\nthe two lines is the solution\nto the equation system",
    xy=(x[0], x[1]),
    xycoords="data",
    xytext=(-120, -75),
    textcoords="offset points",
    arrowprops=dict(arrowstyle="->", connectionstyle="arc3, rad=-.3"),
)

ax.set_xlabel(r"$x_1$", fontsize=18)
ax.set_ylabel(r"$x_2$", fontsize=18)
ax.legend()
fig.tight_layout()
fig.savefig("ch5-linear-systems-simple.pdf")
Symbolic approach
A = sympy.Matrix([[2, 3], [5, 4]])
b = sympy.Matrix([4, 3])A.rank()Loading...
A.condition_number()Loading...
sympy.N(_)Loading...
A.norm()Loading...
L, U, P = A.LUdecomposition()LLoading...
ULoading...
L * ULoading...
x = A.solve(b)xLoading...
Numerical approach
A = np.array([[2, 3], [5, 4]])
b = np.array([4, 3])np.linalg.matrix_rank(A)np.int64(2)np.linalg.cond(A)Loading...
np.linalg.norm(A)Loading...
P, L, U = la.lu(A)Larray([[1. , 0. ],
[0.4, 1. ]])Uarray([[5. , 4. ],
[0. , 1.4]])np.dot(L, U)array([[5., 4.],
[2., 3.]])np.dot(P, np.dot(L, U))array([[2., 3.],
[5., 4.]])P.dot(L.dot(U))array([[2., 3.],
[5., 4.]])la.solve(A, b)array([-1., 2.])Example : rank and condition numbers -> numerical errors
p = sympy.symbols("p", positive=True)A = sympy.Matrix([[1, sympy.sqrt(p)], [1, 1 / sympy.sqrt(p)]])b = sympy.Matrix([1, 2])sympy.simplify(A.solve(b))Loading...
# Symbolic problem specification
p = sympy.symbols("p", positive=True)
A = sympy.Matrix([[1, sympy.sqrt(p)], [1, 1 / sympy.sqrt(p)]])
b = sympy.Matrix([1, 2])

# Solve symbolically
x_sym_sol = A.solve(b)
x_sym_sol.simplify()
x_sym_sol
Acond = A.condition_number().simplify()

# Function for solving numerically
AA = lambda p: np.array([[1, np.sqrt(p)], [1, 1 / np.sqrt(p)]])
bb = np.array([1, 2])
x_num_sol = lambda p: np.linalg.solve(AA(p), bb)

# Graph the difference between the symbolic (exact) and numerical results.
p_vec = np.linspace(0.9, 1.1, 200)

fig, axes = plt.subplots(1, 2, figsize=(12, 4))

for n in range(2):
    x_sym = np.array([x_sym_sol[n].subs(p, pp).evalf() for pp in p_vec])
    x_num = np.array([x_num_sol(pp)[n] for pp in p_vec])
    axes[0].plot(p_vec, (x_num - x_sym) / x_sym, "k")
axes[0].set_title("Error in solution\n(numerical - symbolic)/symbolic")
axes[0].set_xlabel(r"$p$", fontsize=18)

axes[1].plot(p_vec, [Acond.subs(p, pp).evalf() for pp in p_vec])
axes[1].set_title("Condition number")
axes[1].set_xlabel(r"$p$", fontsize=18)

fig.tight_layout()
fig.savefig("ch5-linear-systems-condition-number.pdf")
Rectangular systems
Underdetermined
unknown = sympy.symbols("x, y, z")A = sympy.Matrix([[1, 2, 3], [4, 5, 6]])x = sympy.Matrix(unknown)b = sympy.Matrix([7, 8])AA = A * x - bsympy.solve(A * x - b, unknown)Loading...
Overdetermined: least squares
np.random.seed(1234)

# define true model parameters
x = np.linspace(-1, 1, 100)
a, b, c = 1, 2, 3
y_exact = a + b * x + c * x**2

# simulate noisy data points
m = 100
X = 1 - 2 * np.random.rand(m)
Y = a + b * X + c * X**2 + np.random.randn(m)

# fit the data to the model using linear least square
A = np.vstack([X**0, X**1, X**2])  # see np.vander for alternative
sol, r, rank, sv = la.lstsq(A.T, Y)
y_fit = sol[0] + sol[1] * x + sol[2] * x**2
fig, ax = plt.subplots(figsize=(12, 4))

ax.plot(X, Y, "go", alpha=0.5, label="Simulated data")
ax.plot(x, y_exact, "k", lw=2, label="True value $y = 1 + 2x + 3x^2$")
ax.plot(x, y_fit, "b", lw=2, label="Least square fit")
ax.set_xlabel(r"$x$", fontsize=18)
ax.set_ylabel(r"$y$", fontsize=18)
ax.legend(loc=2)
fig.savefig("ch5-linear-systems-least-square.pdf")
# fit the data to the model using linear least square:
# 1st order polynomial
A = np.vstack([X**n for n in range(2)])
sol, r, rank, sv = la.lstsq(A.T, Y)
y_fit1 = sum([s * x**n for n, s in enumerate(sol)])

# 15th order polynomial
A = np.vstack([X**n for n in range(16)])
sol, r, rank, sv = la.lstsq(A.T, Y)
y_fit15 = sum([s * x**n for n, s in enumerate(sol)])

fig, ax = plt.subplots(figsize=(12, 4))
ax.plot(X, Y, "go", alpha=0.5, label="Simulated data")
ax.plot(x, y_exact, "k", lw=2, label="True value $y = 1 + 2x + 3x^2$")
ax.plot(x, y_fit1, "b", lw=2, label="Least square fit [1st order]")
ax.plot(x, y_fit15, "m", lw=2, label="Least square fit [15th order]")
ax.set_xlabel(r"$x$", fontsize=18)
ax.set_ylabel(r"$y$", fontsize=18)
ax.legend(loc=2)
fig.savefig("ch5-linear-systems-least-square-2.pdf")
Eigenvalue problems
eps, delta = sympy.symbols("epsilon, delta")H = sympy.Matrix([[eps, delta], [delta, -eps]])
HLoading...
eval1, eval2 = H.eigenvals()eval1, eval2Loading...
H.eigenvects()Loading...
(eval1, _, evec1), (eval2, _, evec2) = H.eigenvects()sympy.simplify(evec1[0].T * evec2[0])Loading...
A = np.array([[1, 3, 5], [3, 5, 3], [5, 3, 9]])
A
array([[1, 3, 5],
[3, 5, 3],
[5, 3, 9]])evals, evecs = la.eig(A)evalsarray([13.35310908+0.j, -1.75902942+0.j, 3.40592034+0.j])evecsarray([[ 0.42663918, 0.90353276, -0.04009445],
[ 0.43751227, -0.24498225, -0.8651975 ],
[ 0.79155671, -0.35158534, 0.49982569]])la.eigvalsh(A)array([-1.75902942, 3.40592034, 13.35310908])Nonlinear equations
Univariate
x = np.linspace(-2, 2, 1000)

# four examples of nonlinear functions
f1 = x**2 - x - 1
f2 = x**3 - 3 * np.sin(x)
f3 = np.exp(x) - 2
f4 = 1 - x**2 + np.sin(50 / (1 + x**2))

# plot each function
fig, axes = plt.subplots(1, 4, figsize=(12, 3), sharey=True)

for n, f in enumerate([f1, f2, f3, f4]):
    axes[n].plot(x, f, lw=1.5)
    axes[n].axhline(0, ls=":", color="k")
    axes[n].set_ylim(-5, 5)
    axes[n].set_xticks([-2, -1, 0, 1, 2])
    axes[n].set_xlabel(r"$x$", fontsize=18)

axes[0].set_ylabel(r"$f(x)$", fontsize=18)

titles = [
    r"$f(x)=x^2-x-1$",
    r"$f(x)=x^3-3\sin(x)$",
    r"$f(x)=\exp(x)-2$",
    r"$f(x)=\sin\left(50/(1+x^2)\right)+1-x^2$",
]
for n, title in enumerate(titles):
    axes[n].set_title(title)

fig.tight_layout()
fig.savefig("ch5-nonlinear-plot-equations.pdf")
Symbolic
x, a, b, c = sympy.symbols("x, a, b, c")e = a + b * x + c * x**2sol1, sol2 = sympy.solve(e, x)
sol1, sol2Loading...
e.subs(x, sol1).expand()Loading...
e.subs(x, sol2).expand()Loading...
e = a * sympy.cos(x) - b * sympy.sin(x)sol1, sol2 = sympy.solve(e, x)
sol1, sol2Loading...
e.subs(x, sympy.atan(a / b))Loading...
e.subs(x, sol1).simplify()Loading...
e.subs(x, sol2).simplify()Loading...
# sympy.solve(sympy.sin(x)-x, x)Bisection method
# define a function, desired tolerance and starting interval [a, b]
f = lambda x: np.exp(x) - 2
tol = 0.1
a, b = -2, 2
x = np.linspace(-2.1, 2.1, 1000)

# graph the function f
fig, ax = plt.subplots(1, 1, figsize=(12, 4))

ax.plot(x, f(x), lw=1.5)
ax.axhline(0, ls=":", color="k")
ax.set_xticks([-2, -1, 0, 1, 2])
ax.set_xlabel(r"$x$", fontsize=18)
ax.set_ylabel(r"$f(x)$", fontsize=18)

# find the root using the bisection method and visualize
# the steps in the method in the graph
fa, fb = f(a), f(b)

ax.plot(a, fa, "ko")
ax.plot(b, fb, "ko")
ax.text(a, fa + 0.5, r"$a$", ha="center", fontsize=18)
ax.text(b, fb + 0.5, r"$b$", ha="center", fontsize=18)

n = 1
while b - a > tol:
    m = a + (b - a) / 2
    fm = f(m)

    ax.plot(m, fm, "ko")
    ax.text(m, fm - 0.5, r"$m_%d$" % n, ha="center")
    n += 1

    if np.sign(fa) == np.sign(fm):
        a, fa = m, fm
    else:
        b, fb = m, fm

ax.plot(m, fm, "r*", markersize=10)
ax.annotate(
    "Root approximately at %.3f" % m,
    fontsize=14,
    family="serif",
    xy=(a, fm),
    xycoords="data",
    xytext=(-150, +50),
    textcoords="offset points",
    arrowprops=dict(arrowstyle="->", connectionstyle="arc3, rad=-.5"),
)

ax.set_title("Bisection method")

fig.tight_layout()
fig.savefig("ch5-nonlinear-bisection.pdf")
# define a function, desired tolerance and starting point xk
tol = 0.01
xk = 2

s_x = sympy.symbols("x")
s_f = sympy.exp(s_x) - 2

f = lambda x: sympy.lambdify(s_x, s_f, "numpy")(x)
fp = lambda x: sympy.lambdify(s_x, sympy.diff(s_f, s_x), "numpy")(x)

x = np.linspace(-1, 2.1, 1000)

# setup a graph for visualizing the root finding steps
fig, ax = plt.subplots(1, 1, figsize=(12, 4))

ax.plot(x, f(x))
ax.axhline(0, ls=":", color="k")

# repeat Newton's method until convergence to the desired tolerance has been reached
n = 0
while f(xk) > tol:
    xk_new = xk - f(xk) / fp(xk)

    ax.plot([xk, xk], [0, f(xk)], color="k", ls=":")
    ax.plot(xk, f(xk), "ko")
    ax.text(xk, -0.5, r"$x_%d$" % n, ha="center")
    ax.plot([xk, xk_new], [f(xk), 0], "k-")

    xk = xk_new
    n += 1

ax.plot(xk, f(xk), "r*", markersize=15)
ax.annotate(
    "Root approximately at %.3f" % xk,
    fontsize=14,
    family="serif",
    xy=(xk, f(xk)),
    xycoords="data",
    xytext=(-150, +50),
    textcoords="offset points",
    arrowprops=dict(arrowstyle="->", connectionstyle="arc3, rad=-.5"),
)

ax.set_title("Newton's method")
ax.set_xticks([-1, 0, 1, 2])
fig.tight_layout()
fig.savefig("ch5-nonlinear-newton.pdf")
scipy.optimize functions for root-finding
optimize.bisect(lambda x: np.exp(x) - 2, -2, 2)Loading...
optimize.newton(lambda x: np.exp(x) - 2, 2)Loading...
x_root_guess = 2f = lambda x: np.exp(x) - 2fprime = lambda x: np.exp(x)optimize.newton(f, x_root_guess)Loading...
optimize.newton(f, x_root_guess, fprime=fprime)Loading...
optimize.brentq(lambda x: np.exp(x) - 2, -2, 2)Loading...
optimize.brenth(lambda x: np.exp(x) - 2, -2, 2)Loading...
optimize.ridder(lambda x: np.exp(x) - 2, -2, 2)Loading...
Multivariate
def f(x):
    return [x[1] - x[0] ** 3 - 2 * x[0] ** 2 + 1, x[1] + x[0] ** 2 - 1]
optimize.fsolve(f, [1, 1])array([0.73205081, 0.46410162])def f_jacobian(x):
return [[-3 * x[0] ** 2 - 4 * x[0], 1], [2 * x[0], 1]]optimize.fsolve(f, [1, 1], fprime=f_jacobian)array([0.73205081, 0.46410162])x, y = sympy.symbols("x, y")
f_mat = sympy.Matrix([y - x**3 - 2 * x**2 + 1, y + x**2 - 1])
f_mat.jacobian(sympy.Matrix([x, y]))Loading...
# def f(x):
#    return [x[1] - x[0]**3 - 2 * x[0]**2 + 1, x[1] + x[0]**2 - 1]

x = np.linspace(-3, 2, 5000)
y1 = x**3 + 2 * x**2 - 1
y2 = -(x**2) + 1

fig, ax = plt.subplots(figsize=(8, 4))

ax.plot(x, y1, "b", lw=1.5, label=r"$y = x^3 + 2x^2 - 1$")
ax.plot(x, y2, "g", lw=1.5, label=r"$y = -x^2 + 1$")

x_guesses = [[-2, 2], [1, -1], [-2, -5]]
for x_guess in x_guesses:
    sol = optimize.fsolve(f, x_guess)
    ax.plot(sol[0], sol[1], "r*", markersize=15)

    ax.plot(x_guess[0], x_guess[1], "ko")
    ax.annotate(
        "",
        xy=(sol[0], sol[1]),
        xytext=(x_guess[0], x_guess[1]),
        arrowprops=dict(arrowstyle="->", linewidth=2.5),
    )

ax.legend(loc=0)
ax.set_xlabel(r"$x$", fontsize=18)
fig.tight_layout()
fig.savefig("ch5-nonlinear-system.pdf")
optimize.broyden2(f, x_guesses[1])array([0.73205079, 0.46410162])def f(x):
return [x[1] - x[0] ** 3 - 2 * x[0] ** 2 + 1, x[1] + x[0] ** 2 - 1]
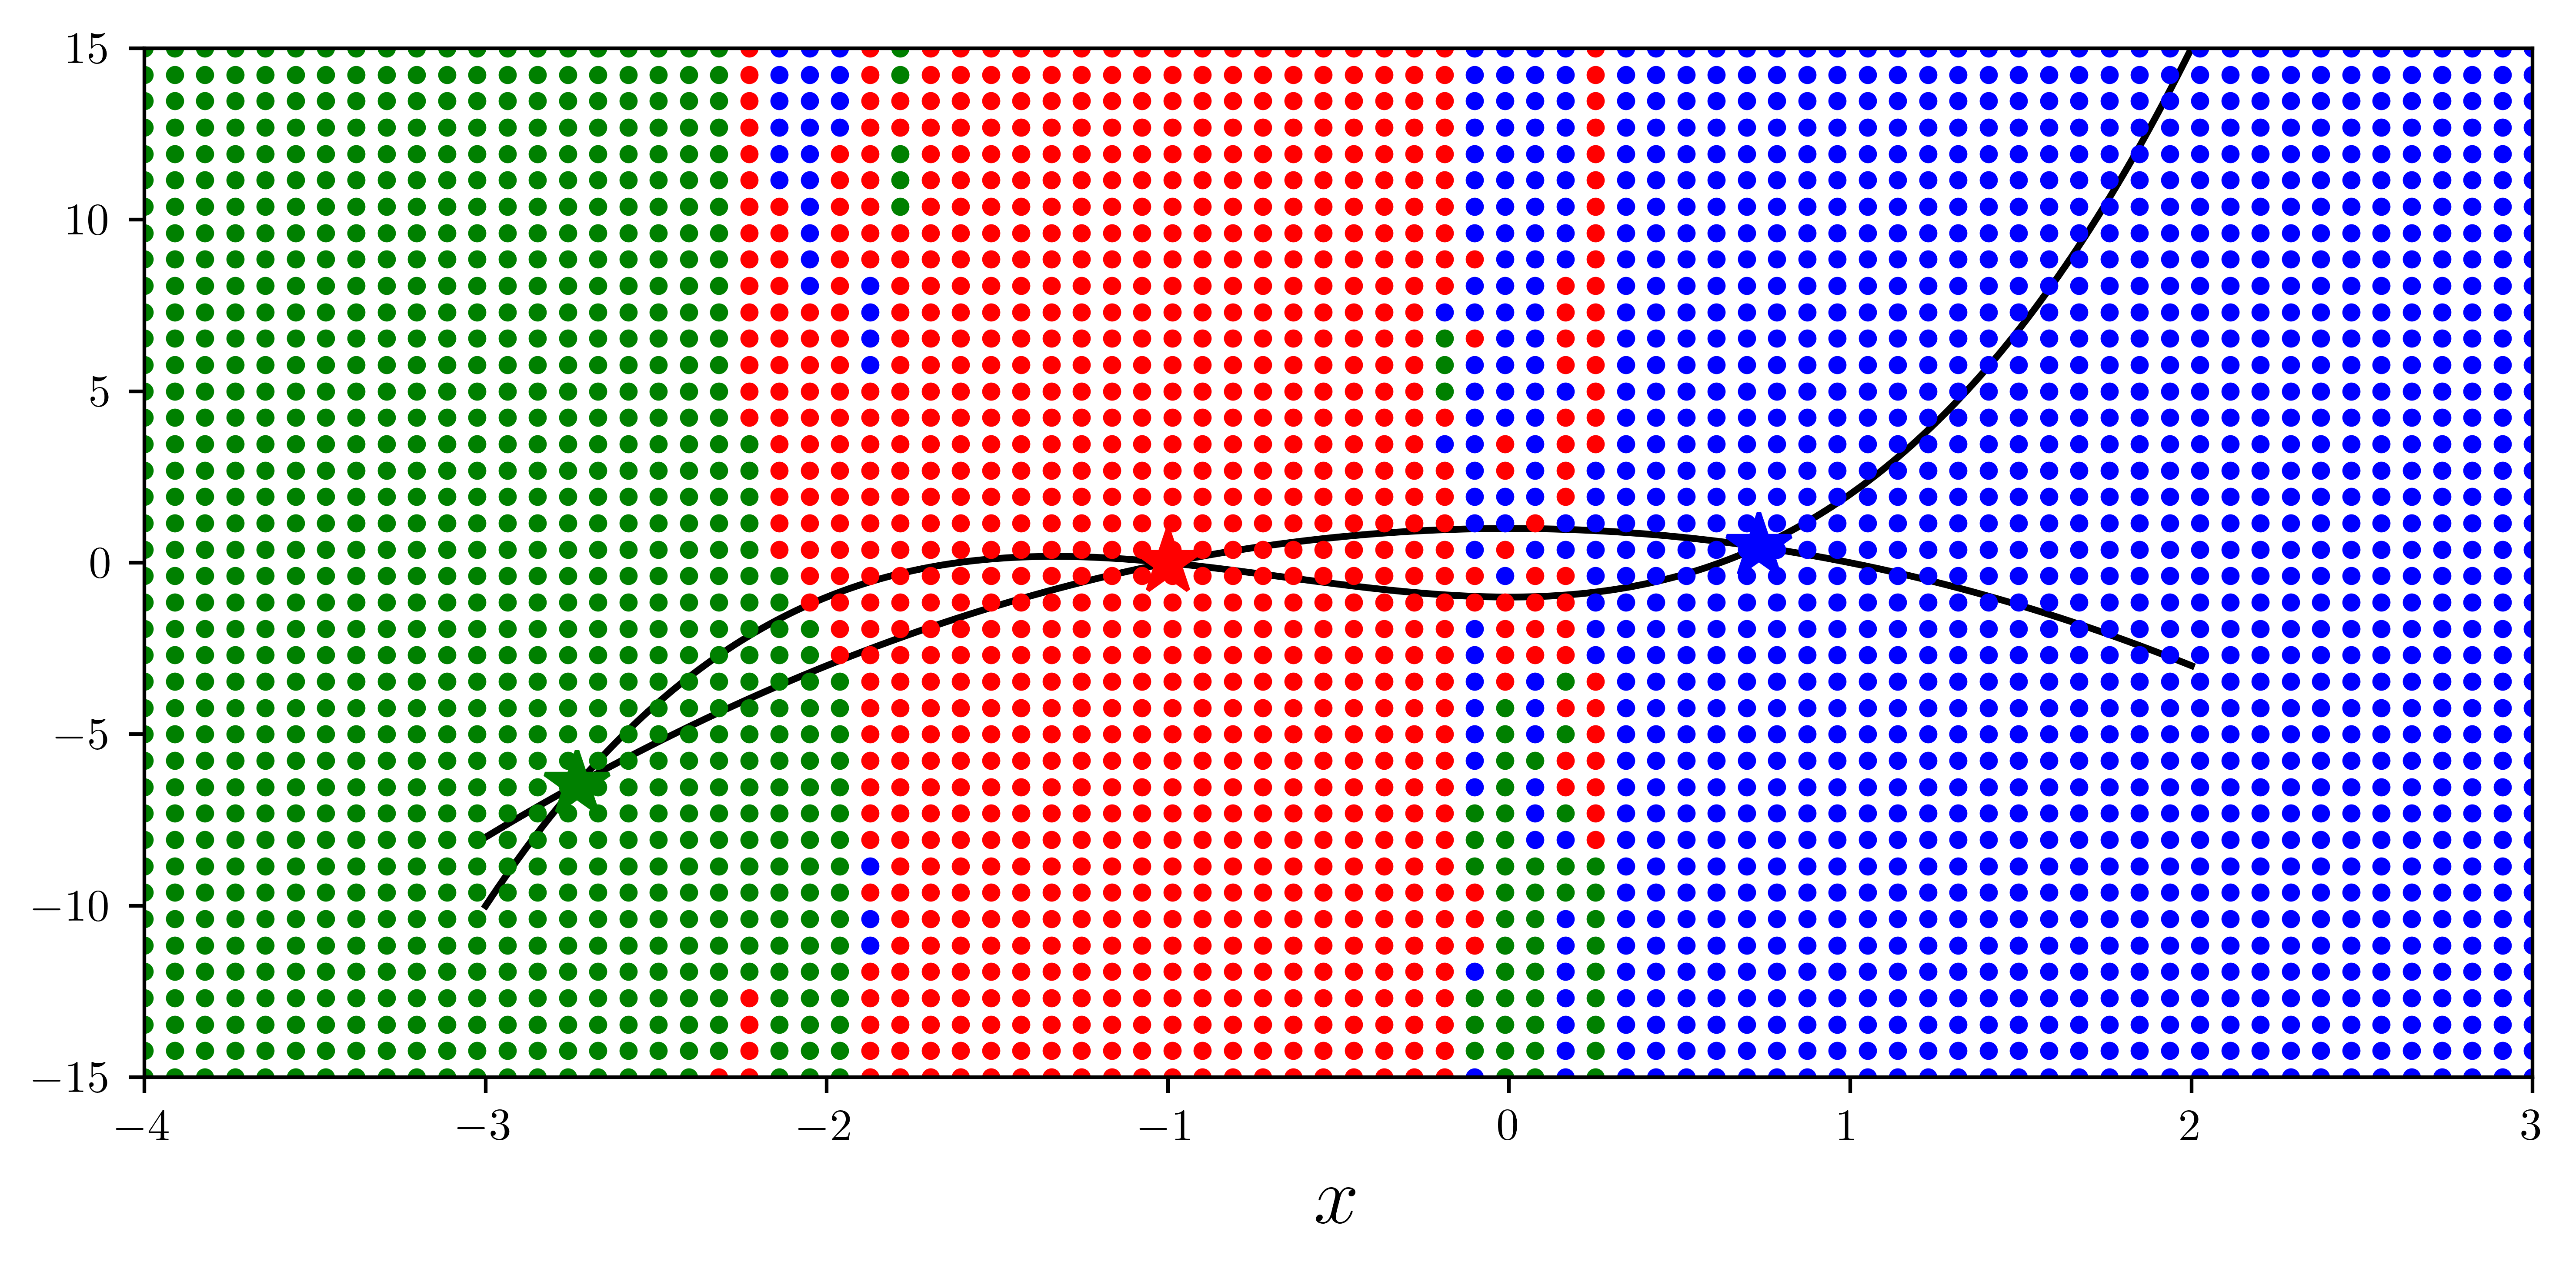
x = np.linspace(-3, 2, 5000)
y1 = x**3 + 2 * x**2 - 1
y2 = -(x**2) + 1
fig, ax = plt.subplots(figsize=(8, 4))
ax.plot(x, y1, "k", lw=1.5, label=r"$y = x^3 + 2x^2 - 1$")
ax.plot(x, y2, "k", lw=1.5, label=r"$y = -x^2 + 1$")
sol1 = optimize.fsolve(f, [-2, 2])
sol2 = optimize.fsolve(f, [1, -1])
sol3 = optimize.fsolve(f, [-2, -5])
sols = [sol1, sol2, sol3]
colors = ["r", "b", "g"]
for idx, s in enumerate(sols):
ax.plot(s[0], s[1], colors[idx] + "*", markersize=15)
for m in np.linspace(-4, 3, 80):
for n in np.linspace(-15, 15, 40):
x_guess = [m, n]
sol = optimize.fsolve(f, x_guess)
idx = (abs(sols - sol) ** 2).sum(axis=1).argmin()
ax.plot(x_guess[0], x_guess[1], colors[idx] + ".")
ax.set_xlabel(r"$x$", fontsize=18)
ax.set_xlim(-4, 3)
ax.set_ylim(-15, 15)
fig.tight_layout()
fig.savefig("ch5-nonlinear-system-map.pdf")/tmp/ipykernel_38844/1451436388.py:25: RuntimeWarning: The iteration is not making good progress, as measured by the
improvement from the last ten iterations.
sol = optimize.fsolve(f, x_guess)
- Johansson, R. (2024). Numerical Python: Scientific Computing and Data Science Applications with Numpy, SciPy and Matplotlib. Apress. 10.1007/979-8-8688-0413-7