Chapter 4: Figures
Robert Johansson
Source code listings for Numerical Python - Scientific Computing and Data Science Applications with Numpy, SciPy and Matplotlib (ISBN 979-8-8688-0412-0).
%matplotlib inline
import matplotlib as mpl
import matplotlib.pyplot as plt
fig = plt.figure()
ax = fig.add_axes([0.05, 0.05, 0.88, 0.88])
ax.set_yticks([])
ax.set_xticks([])
ax.text(0.001, 0.01, "(0,0)")
ax.text(1.001, 0.01, "(1,0)")
ax.text(0.001, 1.01, "(0,1)")
ax.text(1.001, 1.01, "(1,1)")
ax.text(0.02, 0.92, "Figure", fontsize=18)
ax.text(0.12, 0.06, "(0.15, 0.15)")
ax = fig.add_axes([0.15, 0.15, 0.68, 0.66])
ax.text(0.03, 0.88, "Axes", fontsize=18)
ax.set_yticks([])
ax.set_xticks([])
fig.savefig("figure-axes-schematic.pdf");/tmp/ipykernel_37157/3563159362.py:20: UserWarning: This figure includes Axes that are not compatible with tight_layout, so results might be incorrect.
fig.savefig("figure-axes-schematic.pdf");
/usr/lib/python3.14/site-packages/IPython/core/events.py:96: UserWarning: This figure includes Axes that are not compatible with tight_layout, so results might be incorrect.
func(*args, **kwargs)
/usr/lib/python3.14/site-packages/IPython/core/pylabtools.py:170: UserWarning: This figure includes Axes that are not compatible with tight_layout, so results might be incorrect.
fig.canvas.print_figure(bytes_io, **kw)
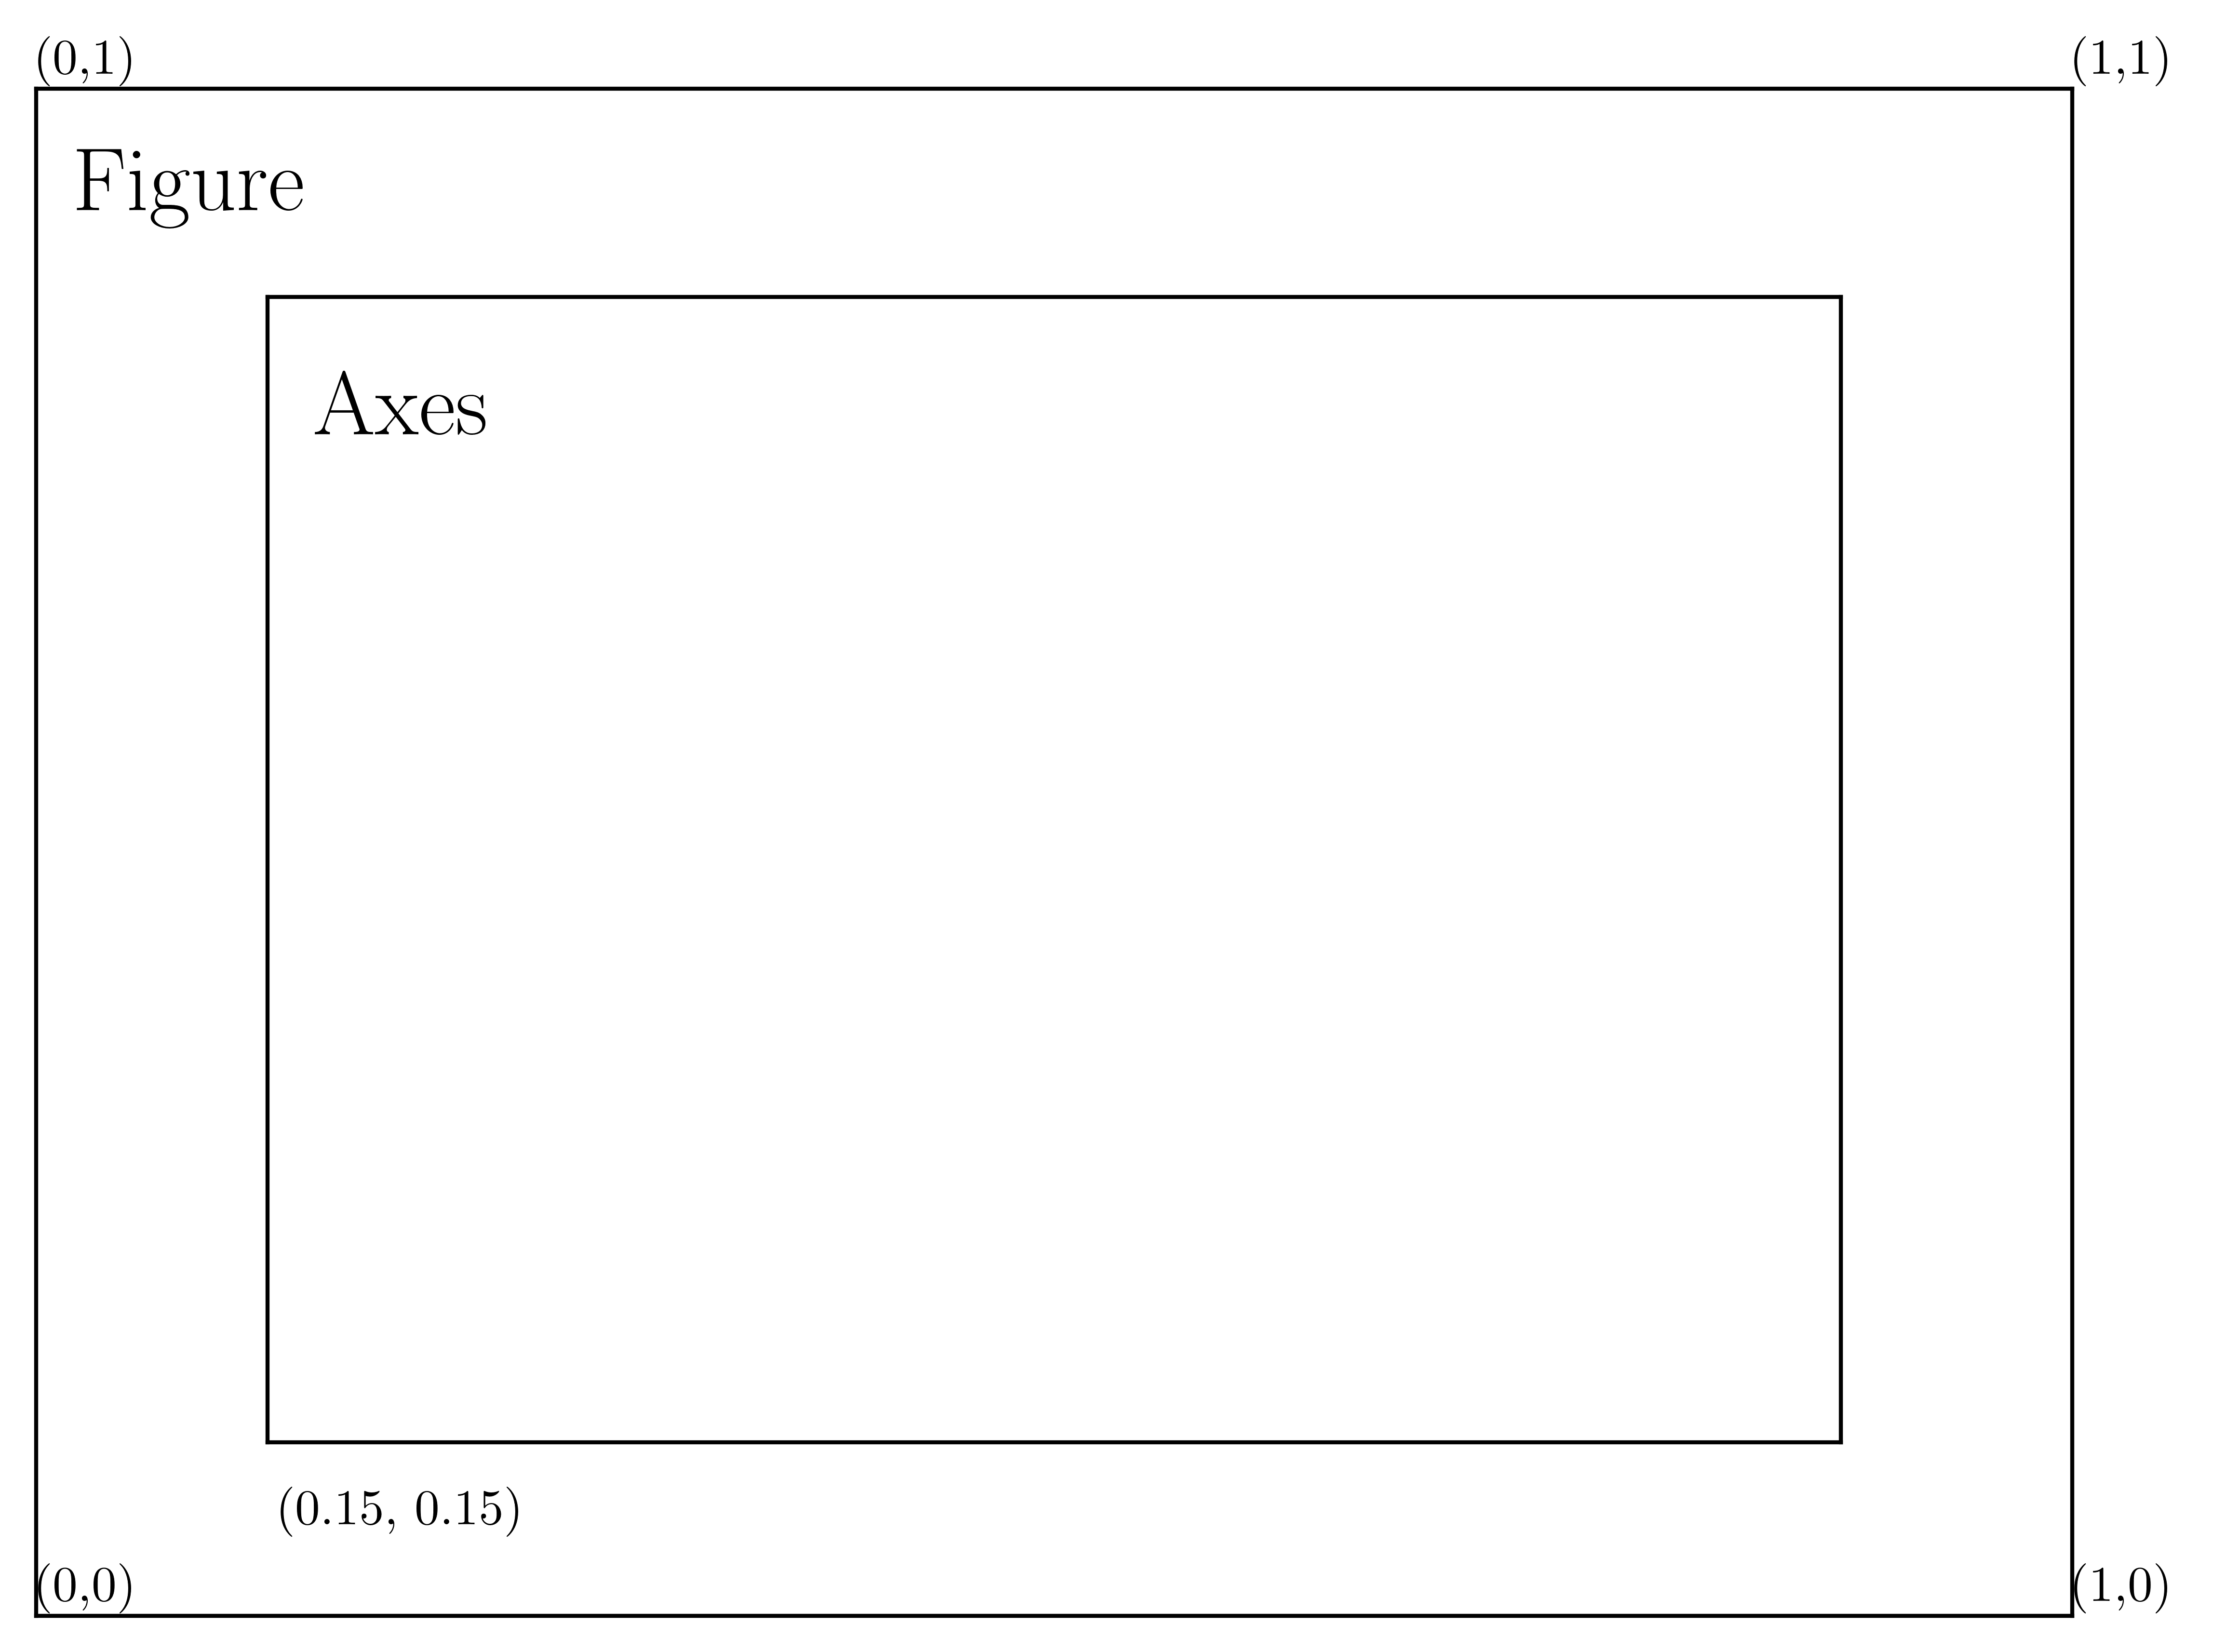
fig = plt.figure()
ax.text(0.12, 0.06, "(0.15, 0.15)")
ax = fig.add_axes([0.15, 0.15, 0.68, 0.66])
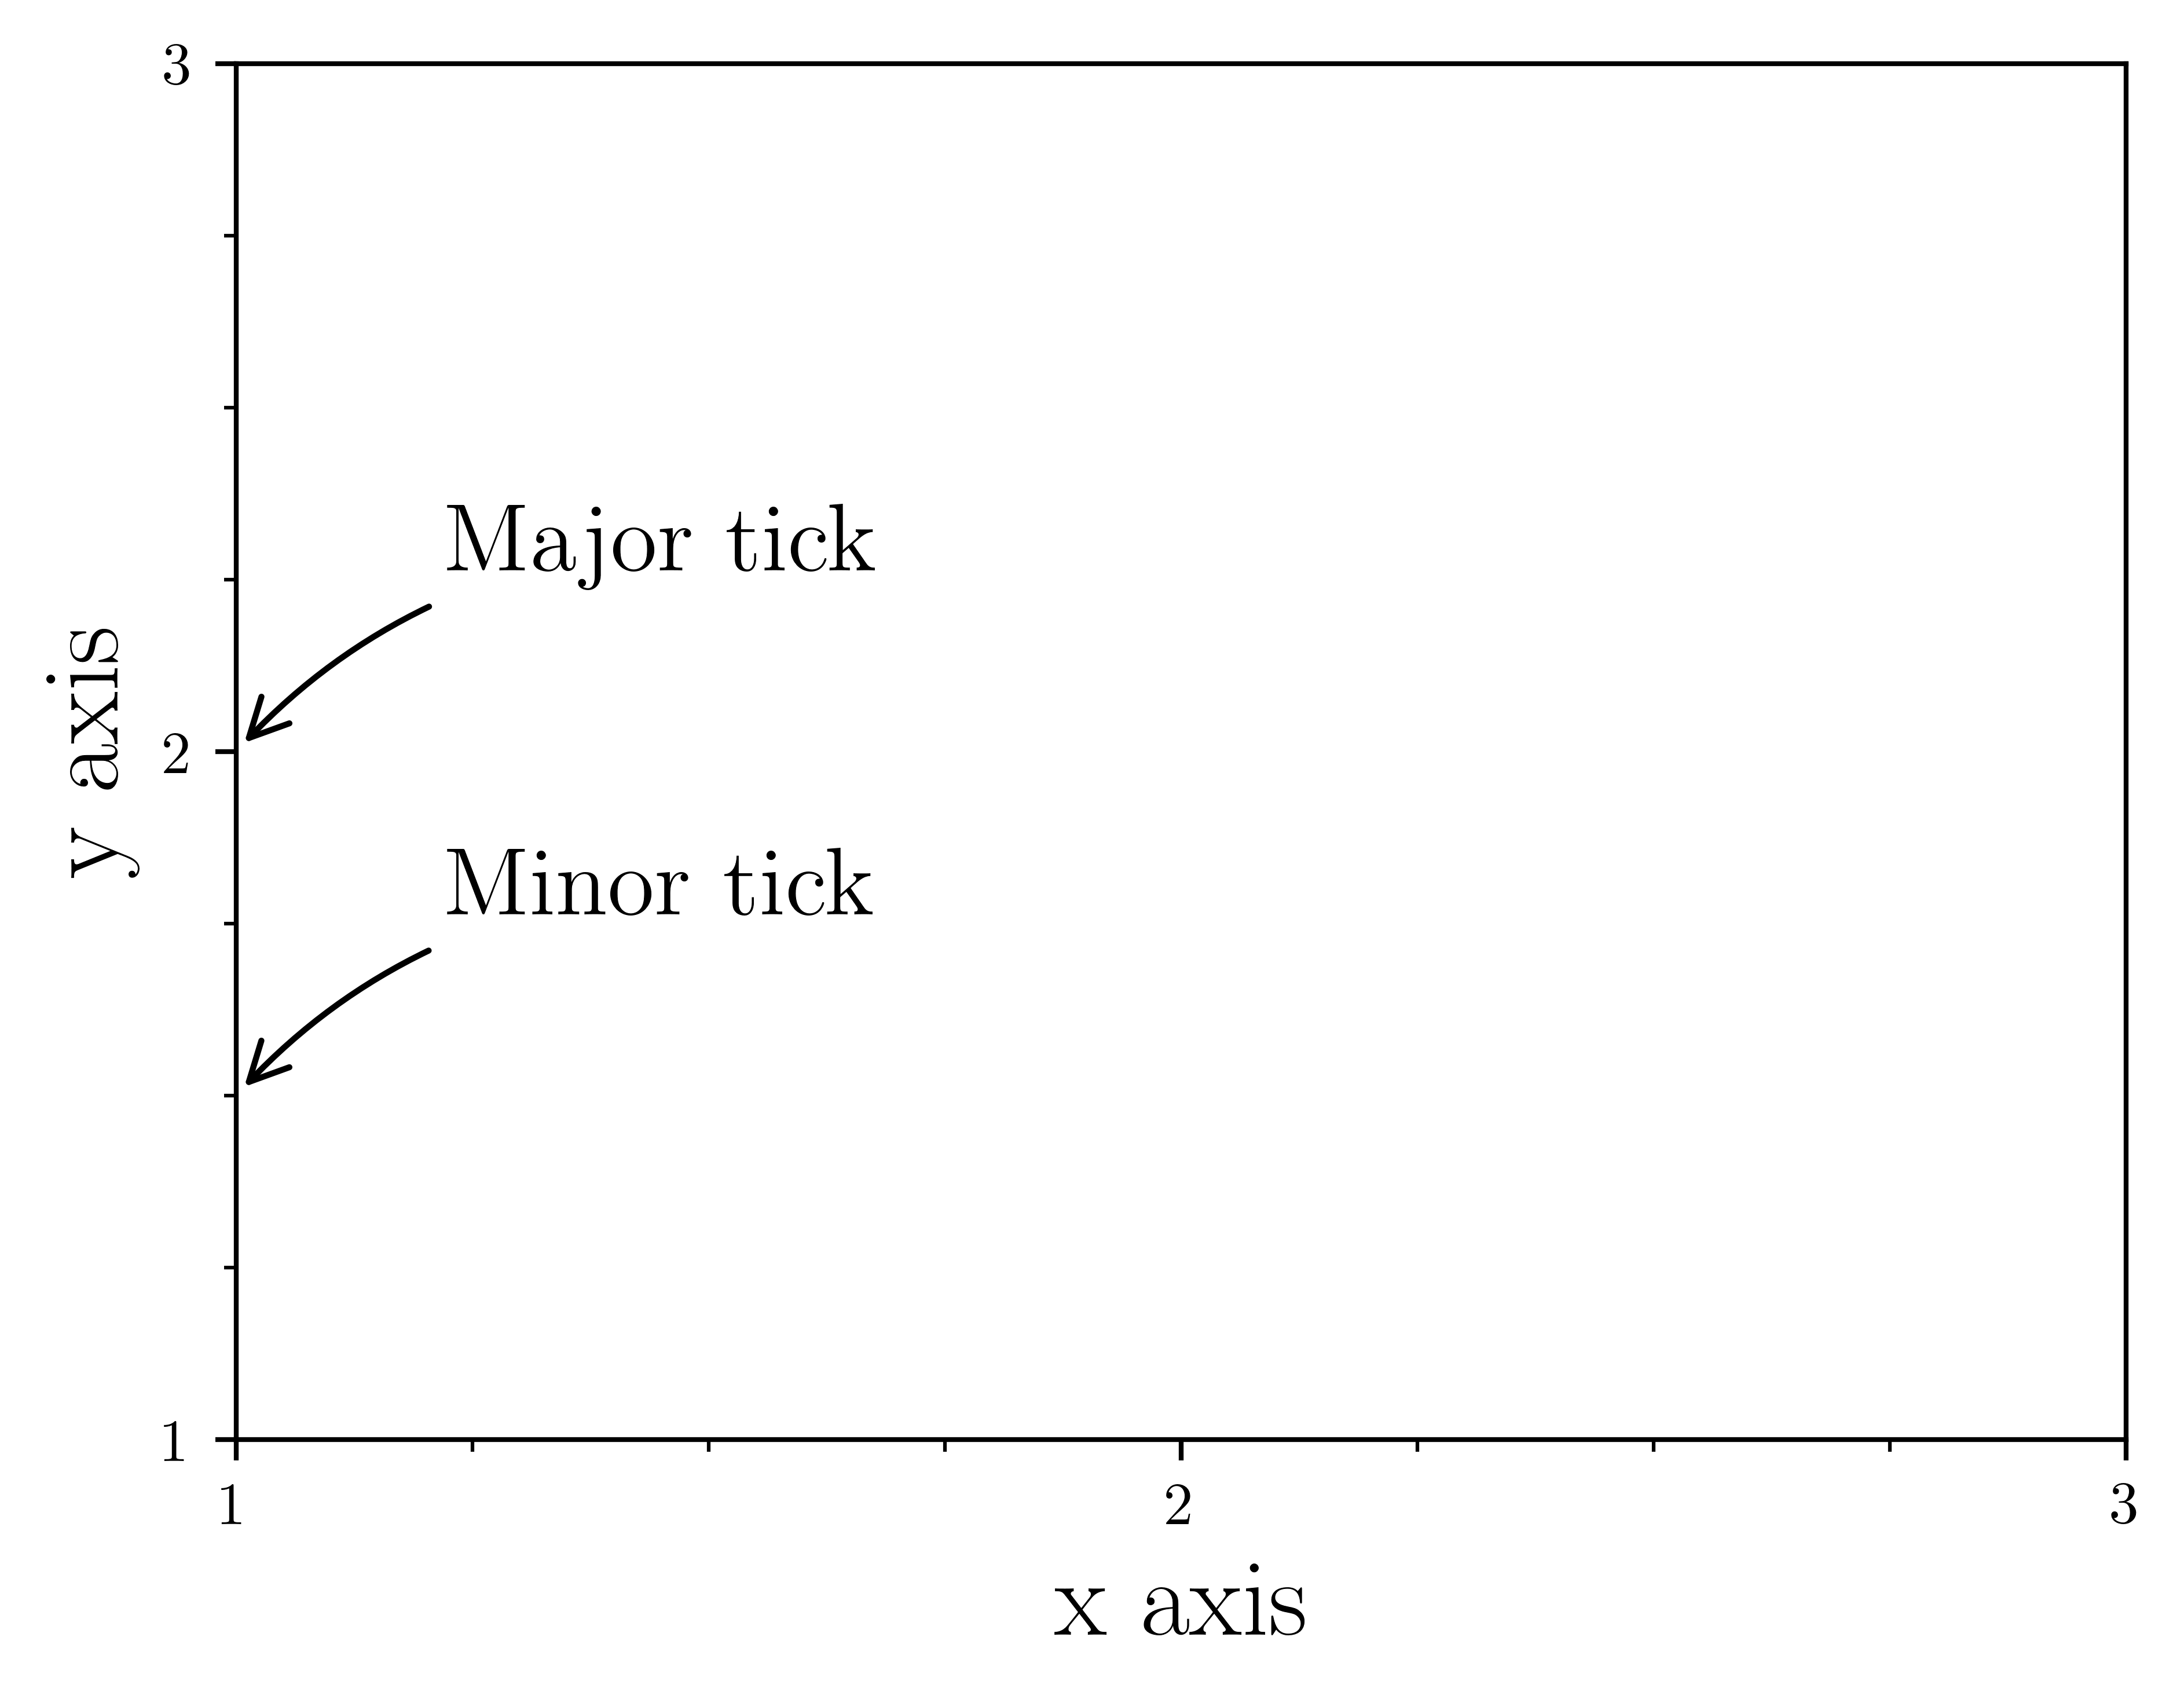
ax.set_yticks([1, 2, 3])
ax.set_xticks([1, 2, 3])
# ax.set_yticklabels(['', '', ''])
ax.set_xlabel("x axis", fontsize=18)
ax.set_ylabel("y axis", fontsize=18)
ax.set_xlim(1, 3)
ax.set_ylim(1, 3)
ax.xaxis.set_minor_locator(mpl.ticker.MultipleLocator(0.25))
ax.yaxis.set_minor_locator(mpl.ticker.MultipleLocator(0.25))
ax.annotate(
"Major tick",
xy=(1, 2),
xycoords="data",
xytext=(+35, +30),
textcoords="offset points",
fontsize=16,
arrowprops=dict(arrowstyle="->", connectionstyle="arc3, rad=.2"),
)
ax.annotate(
"Minor tick",
xy=(1, 1.5),
xycoords="data",
xytext=(+35, +30),
textcoords="offset points",
fontsize=16,
arrowprops=dict(arrowstyle="->", connectionstyle="arc3, rad=.2"),
)
fig.savefig("figure-axis-schematic.pdf");/tmp/ipykernel_37157/2161345264.py:41: UserWarning: This figure includes Axes that are not compatible with tight_layout, so results might be incorrect.
fig.savefig("figure-axis-schematic.pdf");
/usr/lib/python3.14/site-packages/IPython/core/events.py:96: UserWarning: This figure includes Axes that are not compatible with tight_layout, so results might be incorrect.
func(*args, **kwargs)
/usr/lib/python3.14/site-packages/IPython/core/pylabtools.py:170: UserWarning: This figure includes Axes that are not compatible with tight_layout, so results might be incorrect.
fig.canvas.print_figure(bytes_io, **kw)
- Johansson, R. (2024). Numerical Python: Scientific Computing and Data Science Applications with Numpy, SciPy and Matplotlib. Apress. 10.1007/979-8-8688-0413-7