import matplotlib.pyplot as plt
from matplotlib.axes import Axes
from matplotlib.figure import Figure
from pandas import read_csv
from torch import cat, cos, float32, linspace, meshgrid, pi, stack, tensor
from torch.nn import Sequential, Linear, ReLU, Sigmoid, MSELoss, Module
from torch.optim import Adam, SGD
from torch.utils.data import DataLoader
First
X, Y = meshgrid(
    linspace(start=-5, end=5, steps=100),
    linspace(start=-5, end=5, steps=100),
    indexing="xy",
)

fig: Figure
ax: Axes
with plt.style.context("fast"):
    fig, ax = plt.subplots(layout="constrained")
    img = ax.contourf(
        X,
        Y,
        20
        + (X * X - 10 * cos(tensor(2 * pi) * X))
        + (Y * Y - 10 * cos(tensor(2 * pi) * Y)),
        levels=50,
    )
    ax.set_xlabel(xlabel=r"$x$")
    ax.set_ylabel(ylabel=r"$y$")
    ax.set_title(
        label="Solution",
        loc="center",
        wrap=True,
    )
    ax.spines["bottom"].set_color("none")
    ax.spines["top"].set_color("none")
    ax.spines["left"].set_color("none")
    ax.spines["right"].set_color("none")
    fig.colorbar(mappable=img)
    fig.savefig("meshplot.pdf", transparent=True, bbox_inches="tight")
    plt.show()
    fig.clf()
class Net(Module):
    def __init__(self):
        super().__init__()
        self.model = Sequential(
            Linear(2, 64), ReLU(), Linear(64, 64), ReLU(), Linear(64, 1)
        )

    def forward(self, x):
        x = self.model(x)
        return x
XTrain, YTrain = meshgrid(linspace(-3, 3, 100), linspace(-3, 3, 100), indexing="xy")
ZTrain = (
20
+ (XTrain * XTrain - 10 * cos(tensor(2 * pi) * X))
+ (YTrain * YTrain - 10 * cos(tensor(2 * pi) * Y))
)
lossFunction = MSELoss()
net = Net()
losses = []
for _ in range(10000):
zPred = net(cat((XTrain.reshape(-1, 1), YTrain.reshape(-1, 1)), dim=1))
loss = lossFunction(zPred.reshape(XTrain.shape), ZTrain)
net.zero_grad()
loss.backward()
for param in net.parameters():
param.data -= 0.001 * param.grad
losses.append(loss.data)with plt.style.context("seaborn-v0_8-white"):
fig, ax = plt.subplots(layout="constrained")
ax.plot(
losses,
color="red",
label="Fit",
linestyle="solid",
linewidth=0.8,
)
ax.grid(c="gray", linewidth=0.1, linestyle="dashed")
ax.set_xlim(left=0, right=stack(losses).size()[0])
ax.set_ylim(bottom=stack(losses).min() - 8e-2, top=stack(losses).max() + 2e-1)
ax.set_xlabel(xlabel="Epoch")
ax.set_ylabel(ylabel="Loss")
ax.legend(loc="best", title="Legend", shadow=True, fontsize=12)
ax.set_title(
label="Training Loss",
loc="center",
wrap=True,
)
ax.spines["bottom"].set_color("none")
ax.spines["top"].set_color("none")
ax.spines["left"].set_color("none")
ax.spines["right"].set_color("none")
fig.savefig("trainingloss.pdf", transparent=True, bbox_inches="tight")
plt.show()
fig.clf()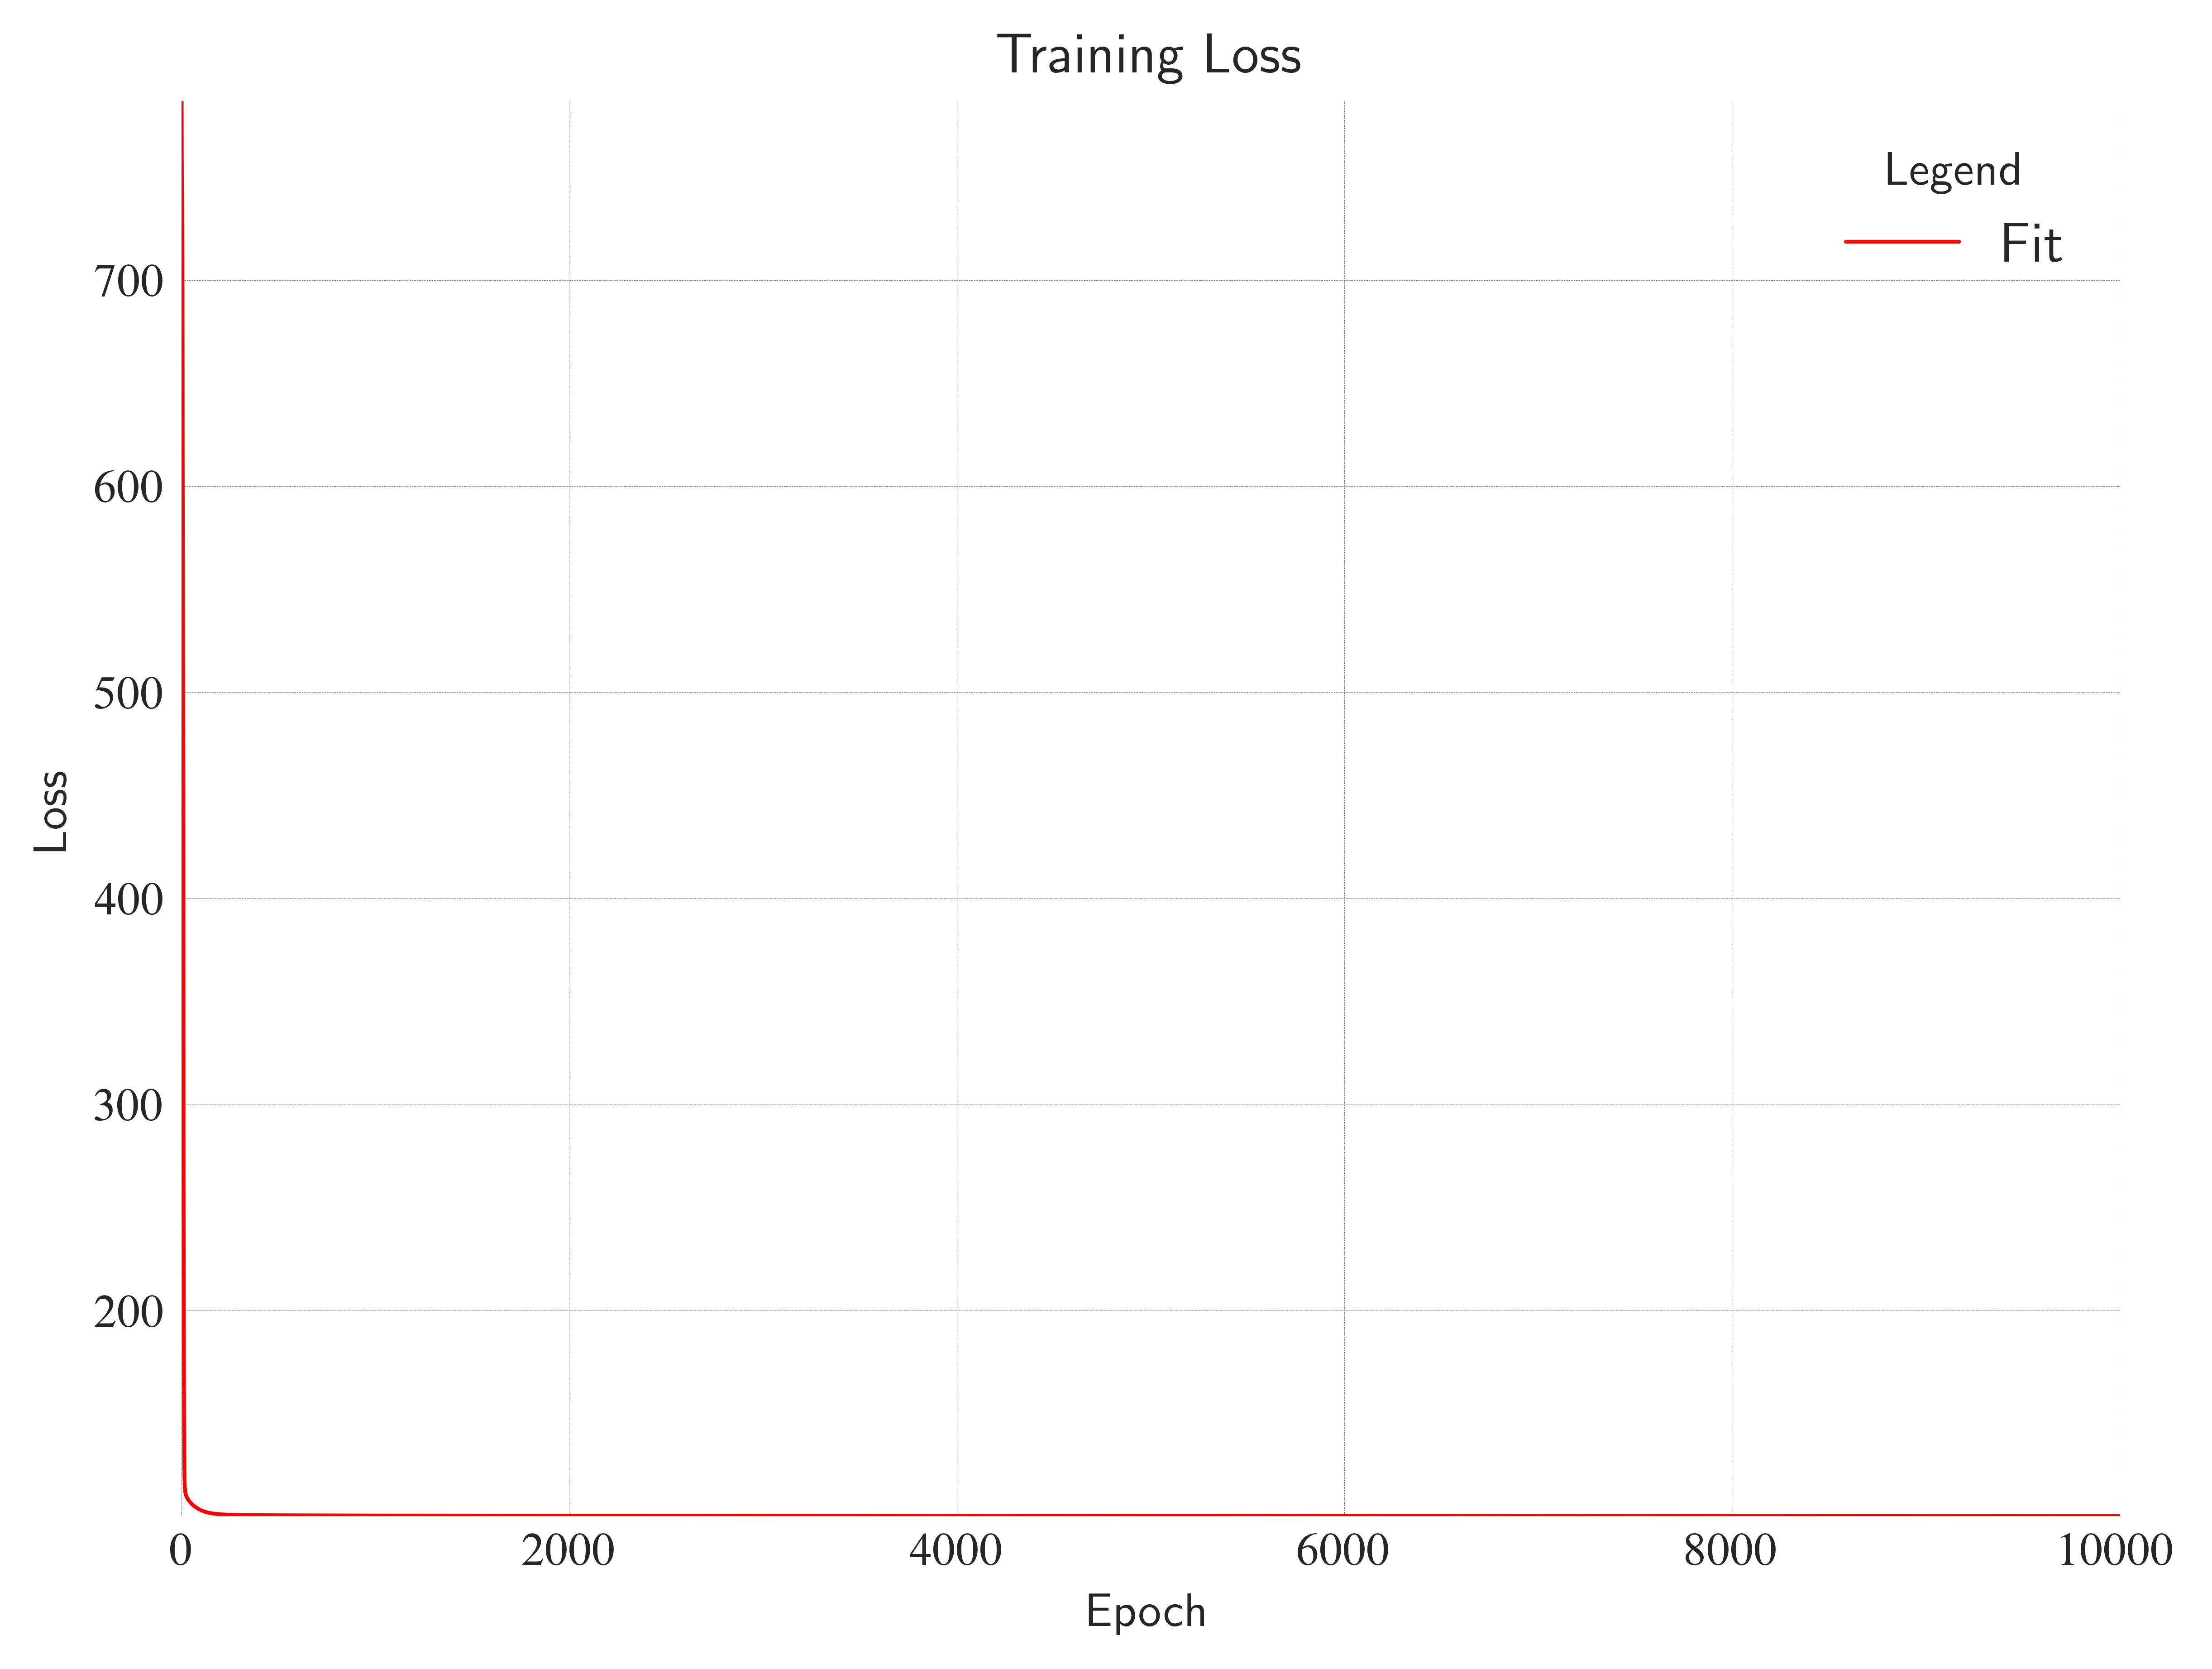
X, Y = meshgrid(
    linspace(start=-3, end=3, steps=100),
    linspace(start=-3, end=3, steps=100),
    indexing="xy",
)

with plt.style.context("fast"):
    fig, ax = plt.subplots(layout="constrained")
    img = ax.contourf(
        X,
        Y,
        net(cat((X.reshape(-1, 1), Y.reshape(-1, 1)), dim=1)).reshape(X.shape).data,
        levels=50,
    )
    ax.set_xlabel(xlabel=r"$x$")
    ax.set_ylabel(ylabel=r"$y$")
    ax.set_title(
        label="Solution",
        loc="center",
        wrap=True,
    )
    ax.spines["bottom"].set_color("none")
    ax.spines["top"].set_color("none")
    ax.spines["left"].set_color("none")
    ax.spines["right"].set_color("none")
    fig.colorbar(mappable=img)
    fig.savefig("meshplot2.pdf", transparent=True, bbox_inches="tight")
    plt.show()
    fig.clf()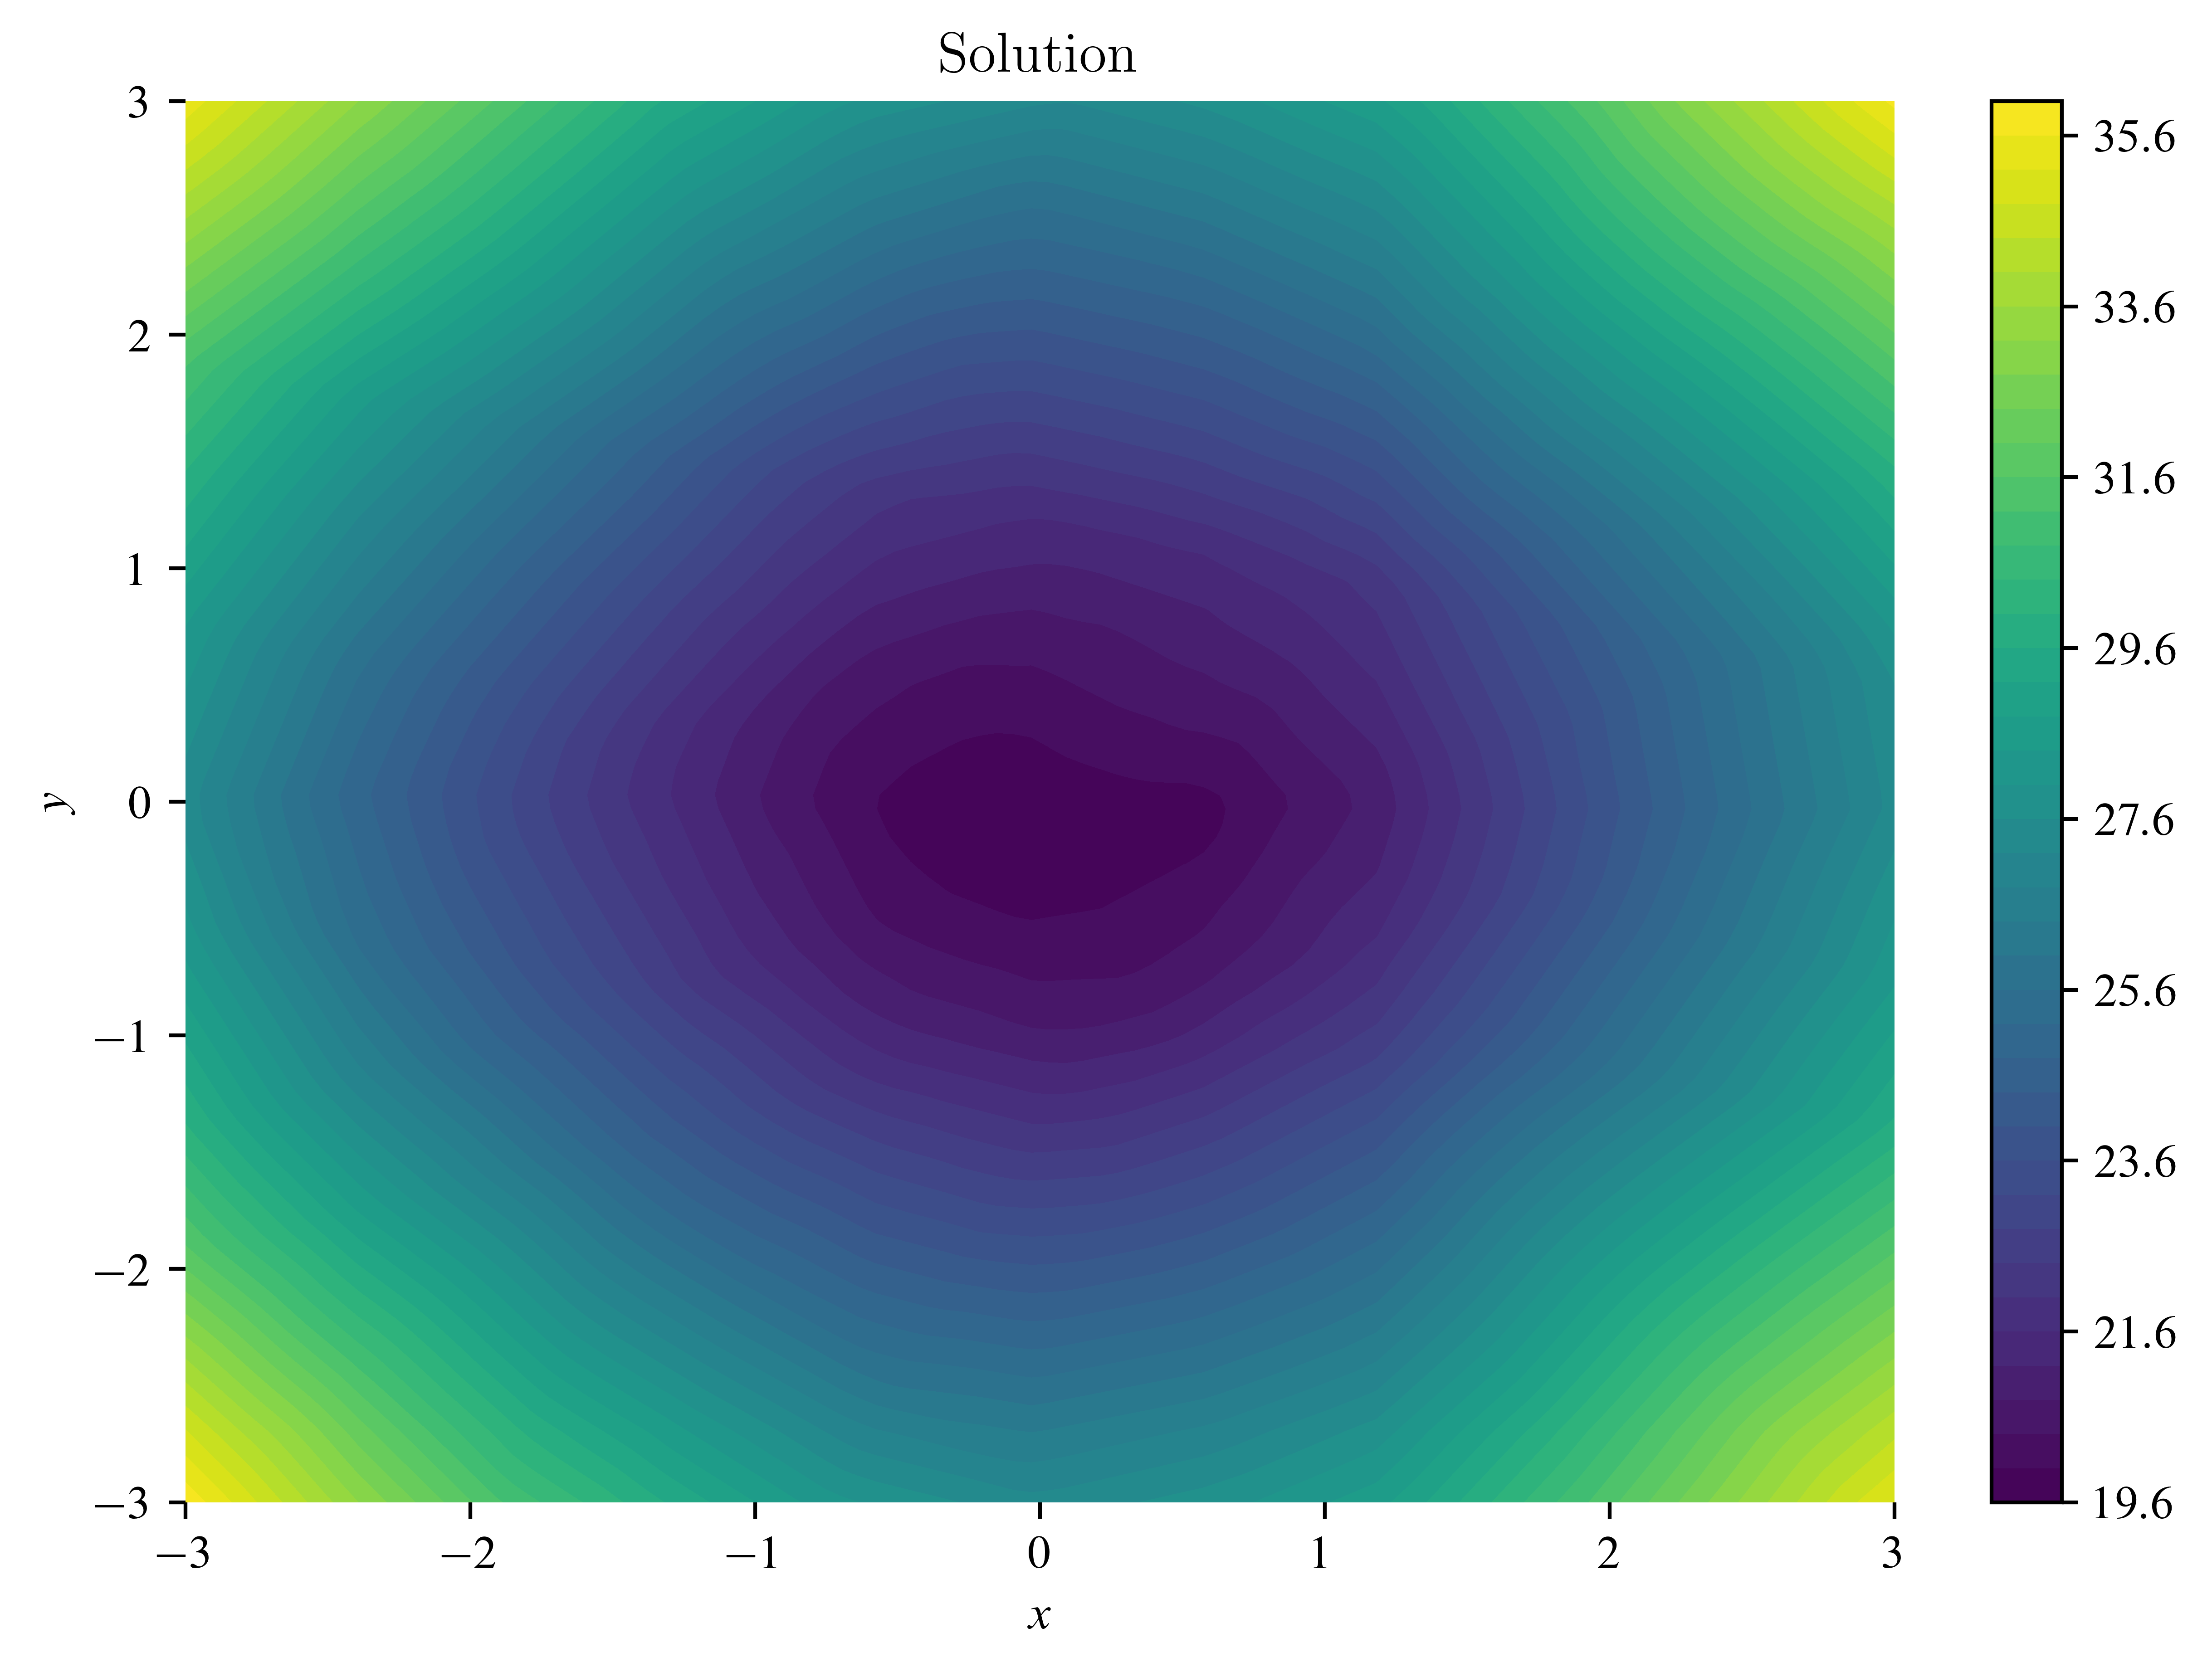
X, Y = meshgrid(
    linspace(start=-5, end=5, steps=100),
    linspace(start=-5, end=5, steps=100),
    indexing="xy",
)

with plt.style.context("fast"):
    fig, ax = plt.subplots(layout="constrained")
    img = ax.contourf(
        X,
        Y,
        net(cat((X.reshape(-1, 1), Y.reshape(-1, 1)), dim=1)).reshape(X.shape).data,
        levels=50,
    )
    ax.set_xlabel(xlabel=r"$x$")
    ax.set_ylabel(ylabel=r"$y$")
    ax.set_title(
        label="Solution",
        loc="center",
        wrap=True,
    )
    ax.spines["bottom"].set_color("none")
    ax.spines["top"].set_color("none")
    ax.spines["left"].set_color("none")
    ax.spines["right"].set_color("none")
    fig.colorbar(mappable=img)
    fig.savefig("meshplot3.pdf", transparent=True, bbox_inches="tight")
    plt.show()
    fig.clf()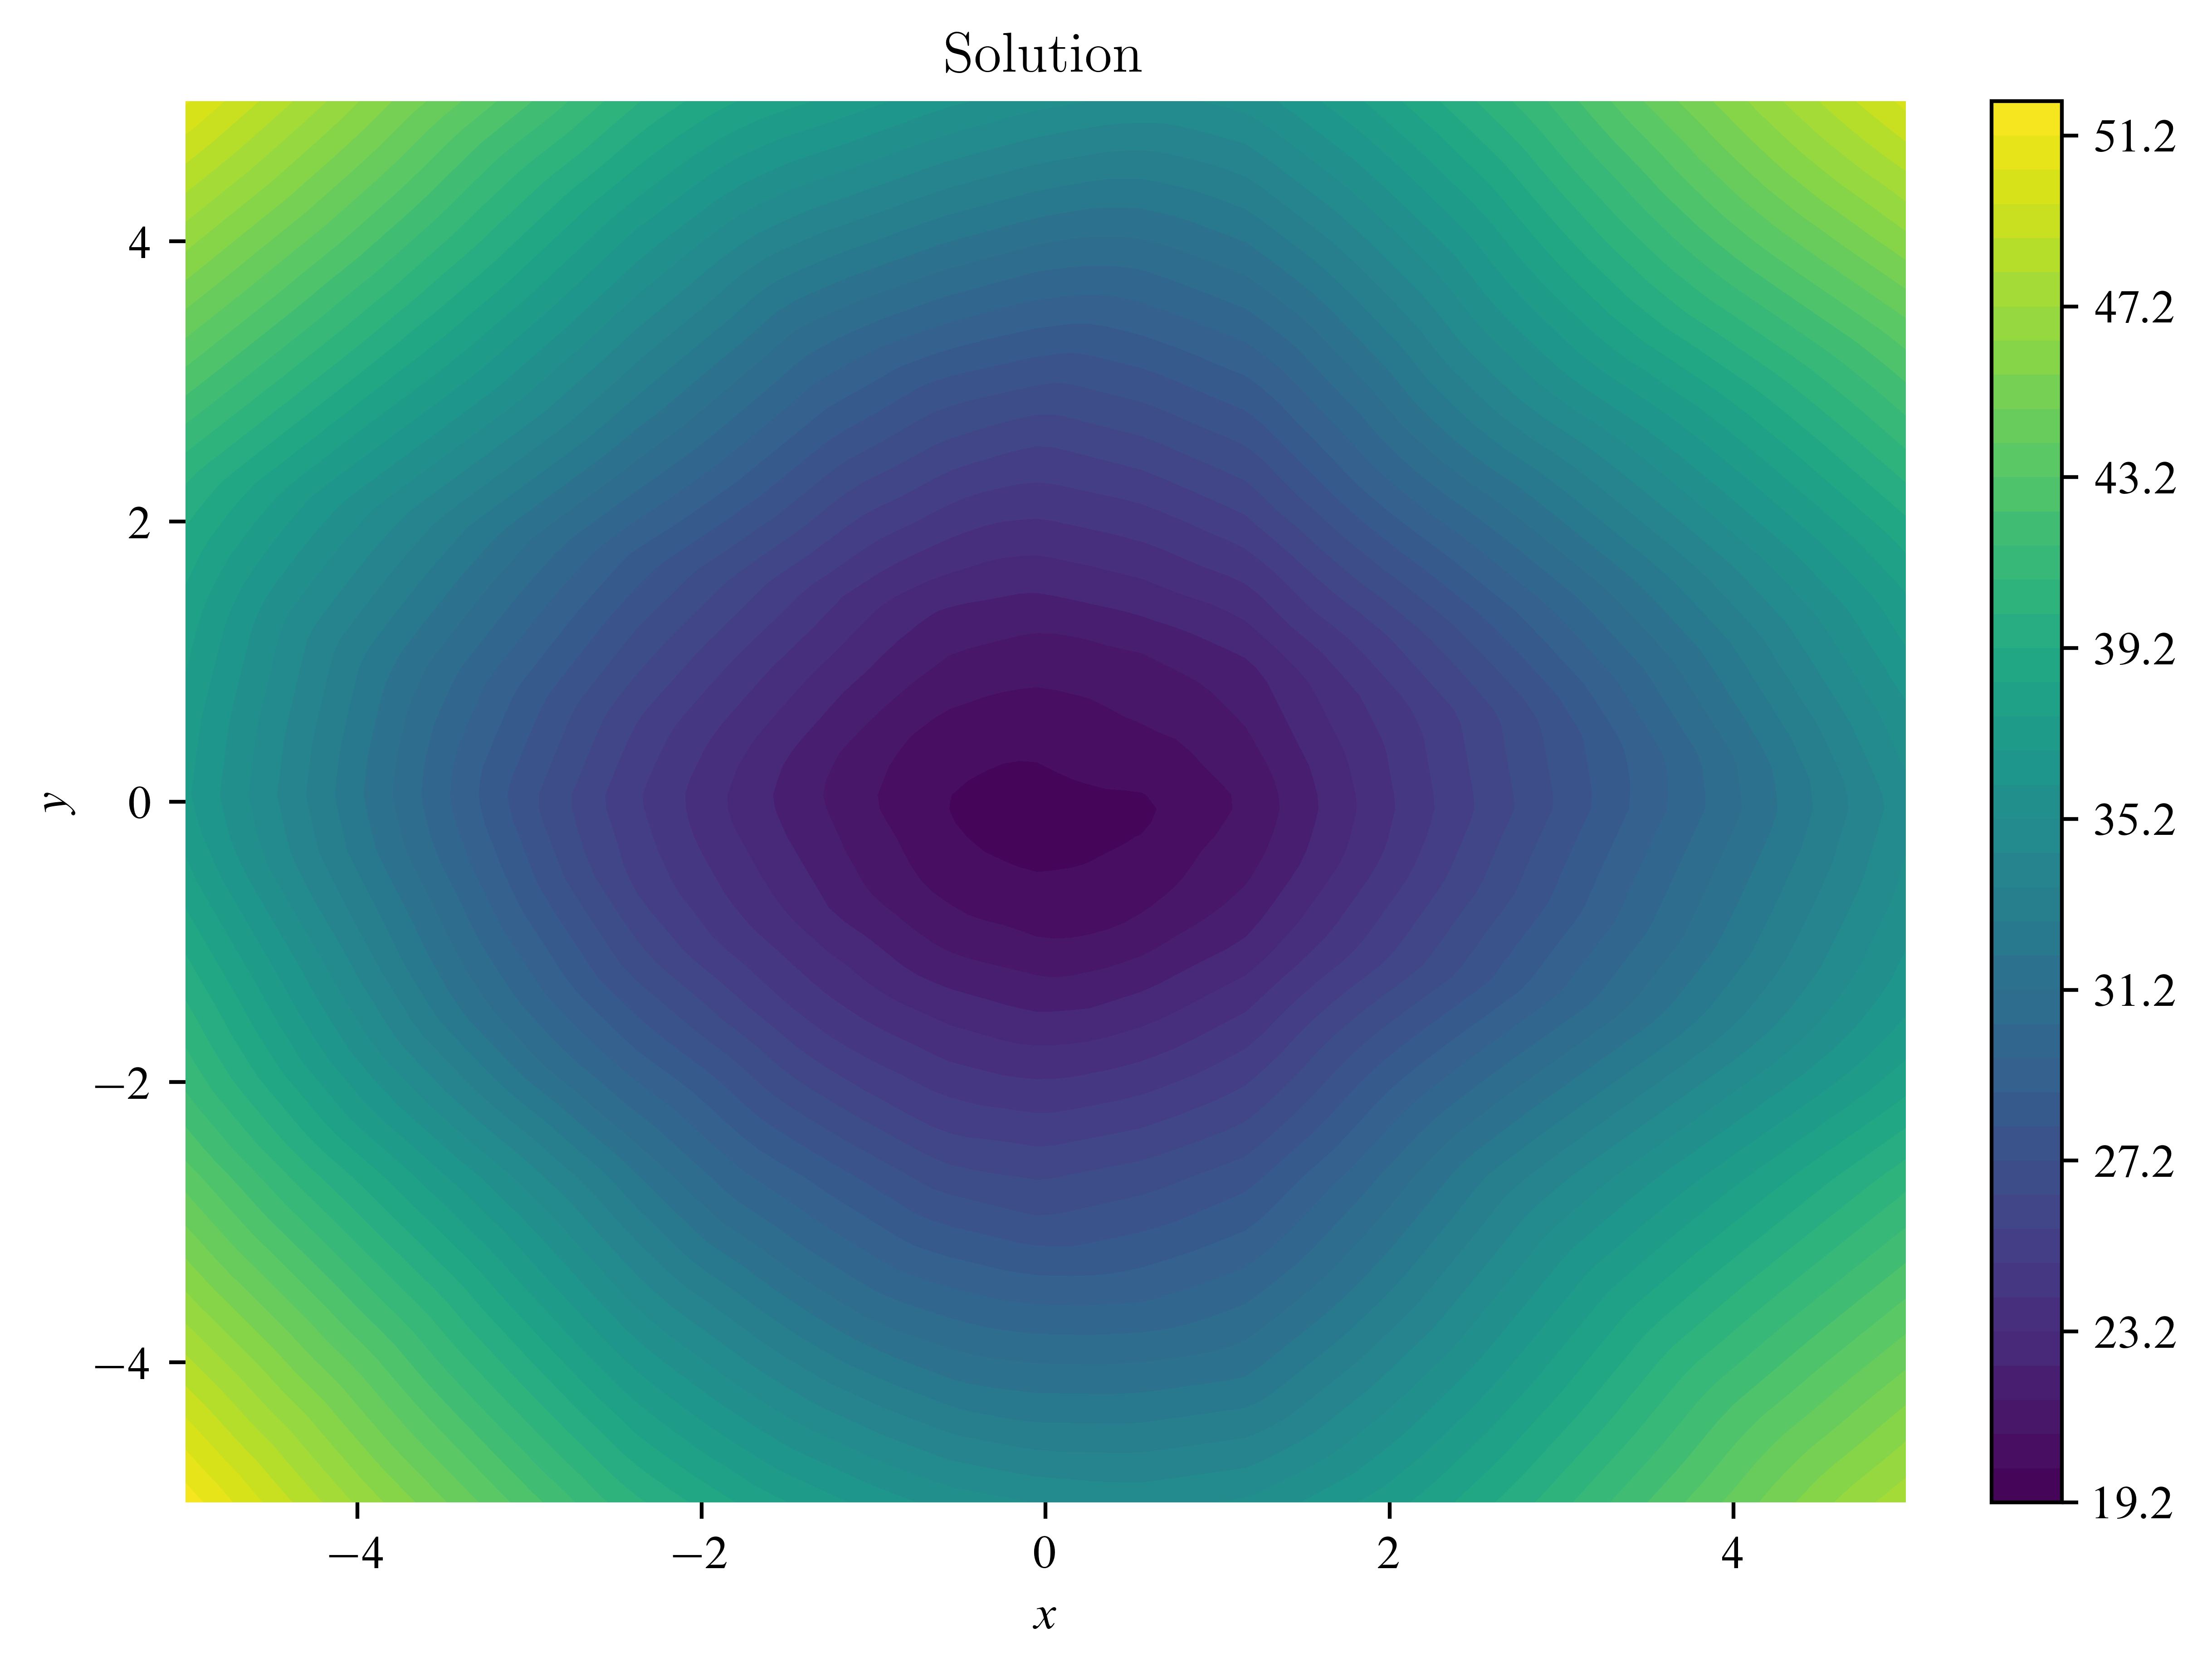
Second
X = tensor(data=[[0, 0], [0, 1], [1, 0], [1, 1]], dtype=float32)
y = tensor(data=[[0], [1], [1], [0]], dtype=float32)


class NetXOR(Module):
    def __init__(self):
        super().__init__()
        self.model = Sequential(
            Linear(2, 2), ReLU(), Linear(2, 1), Sigmoid()
        )

    def forward(self, x):
        x = self.model(x)
        return x
net = NetXOR()
optimizer = SGD(net.parameters(), lr=0.1)
lossFunction = MSELoss()
losses = []
for epoch in range(10000):
yPred = net(X)
loss = lossFunction(yPred, y)
net.zero_grad()
loss.backward()
optimizer.step()
losses.append(loss.data)
if epoch % 1000 == 0:
print(f"Epoch {epoch}, Loss: {loss.item()}")Epoch 0, Loss: 0.25576287508010864
Epoch 1000, Loss: 0.16883695125579834
Epoch 2000, Loss: 0.167246013879776
Epoch 3000, Loss: 0.16695953905582428
Epoch 4000, Loss: 0.16685760021209717
Epoch 5000, Loss: 0.1668086051940918
Epoch 6000, Loss: 0.1667816936969757
Epoch 7000, Loss: 0.1667579859495163
Epoch 8000, Loss: 0.16674380004405975
Epoch 9000, Loss: 0.16673120856285095
with plt.style.context("seaborn-v0_8-white"):
    fig, ax = plt.subplots(layout="constrained")
    ax.plot(
        losses,
        color="red",
        label="Fit",
        linestyle="solid",
        linewidth=0.8,
    )
    ax.grid(c="gray", linewidth=0.1, linestyle="dashed")
    ax.set_xlim(left=0, right=stack(losses).size()[0])
    ax.set_ylim(bottom=stack(losses).min(), top=stack(losses).max())
    ax.set_xlabel(xlabel="Epoch")
    ax.set_ylabel(ylabel="Loss")
    ax.spines["bottom"].set_color("none")
    ax.spines["top"].set_color("none")
    ax.spines["left"].set_color("none")
    ax.spines["right"].set_color("none")
    ax.set_title(
        label="Training Loss",
        loc="center",
        wrap=True,
    )
    ax.legend(loc="best", title="Legend", shadow=True, fontsize=12)
    plt.show()
    fig.clf()
net(X)tensor([[0.0150],
[0.6663],
[0.6663],
[0.6663]], grad_fn=<SigmoidBackward0>)Third
data = read_csv(filepath_or_buffer="house_price_regression_dataset.csv")data.describe()Loading...
data.head()Loading...
X, y = data.drop(labels="House_Price", axis=1), data["House_Price"]
X_scaled = (X - X.mean()) / X.std()
y_scaled = (y - y.mean()) / y.std()
loader = DataLoader(
    dataset=list(zip(X_scaled.values, y_scaled.values)),
    batch_size=32,
    shuffle=True,
)X.head()Loading...
X_scaled.head()Loading...
class Net(Module):
    def __init__(self):
        super().__init__()
        self.model = Sequential(
            Linear(7, 64),
            ReLU(),
            Linear(64, 64),
            ReLU(),
            Linear(64, 64),
            ReLU(),
            Linear(64, 1),
        )

    def forward(self, x):
        x = self.model(x)
        return x
error = MSELoss()
net = Net()
optimizer = Adam(net.parameters(), lr=0.01)
losses = []
for i in range(1000):
for x_batch, y_batch in loader:
y_pred = net(x_batch.float())
loss = error(y_pred.reshape(-1), y_batch.float())
net.zero_grad()
loss.backward()
optimizer.step()
losses.append(loss.data)with plt.style.context("seaborn-v0_8-white"):
fig, ax = plt.subplots(layout="constrained")
ax.plot(
losses,
color="red",
label="Fit",
linestyle="solid",
linewidth=0.8,
)
ax.grid(c="gray", linewidth=0.1, linestyle="dashed")
ax.set_xlim(left=0, right=stack(losses).size()[0])
ax.set_ylim(bottom=stack(losses).min(), top=stack(losses).max())
ax.set_xlabel(xlabel="Epoch")
ax.set_ylabel(ylabel="Loss")
ax.spines["bottom"].set_color("none")
ax.spines["top"].set_color("none")
ax.spines["left"].set_color("none")
ax.spines["right"].set_color("none")
ax.set_title(
label="Training Loss",
loc="center",
wrap=True,
)
ax.legend(loc="best", title="Legend", shadow=True, fontsize=12)
plt.show()
fig.clf()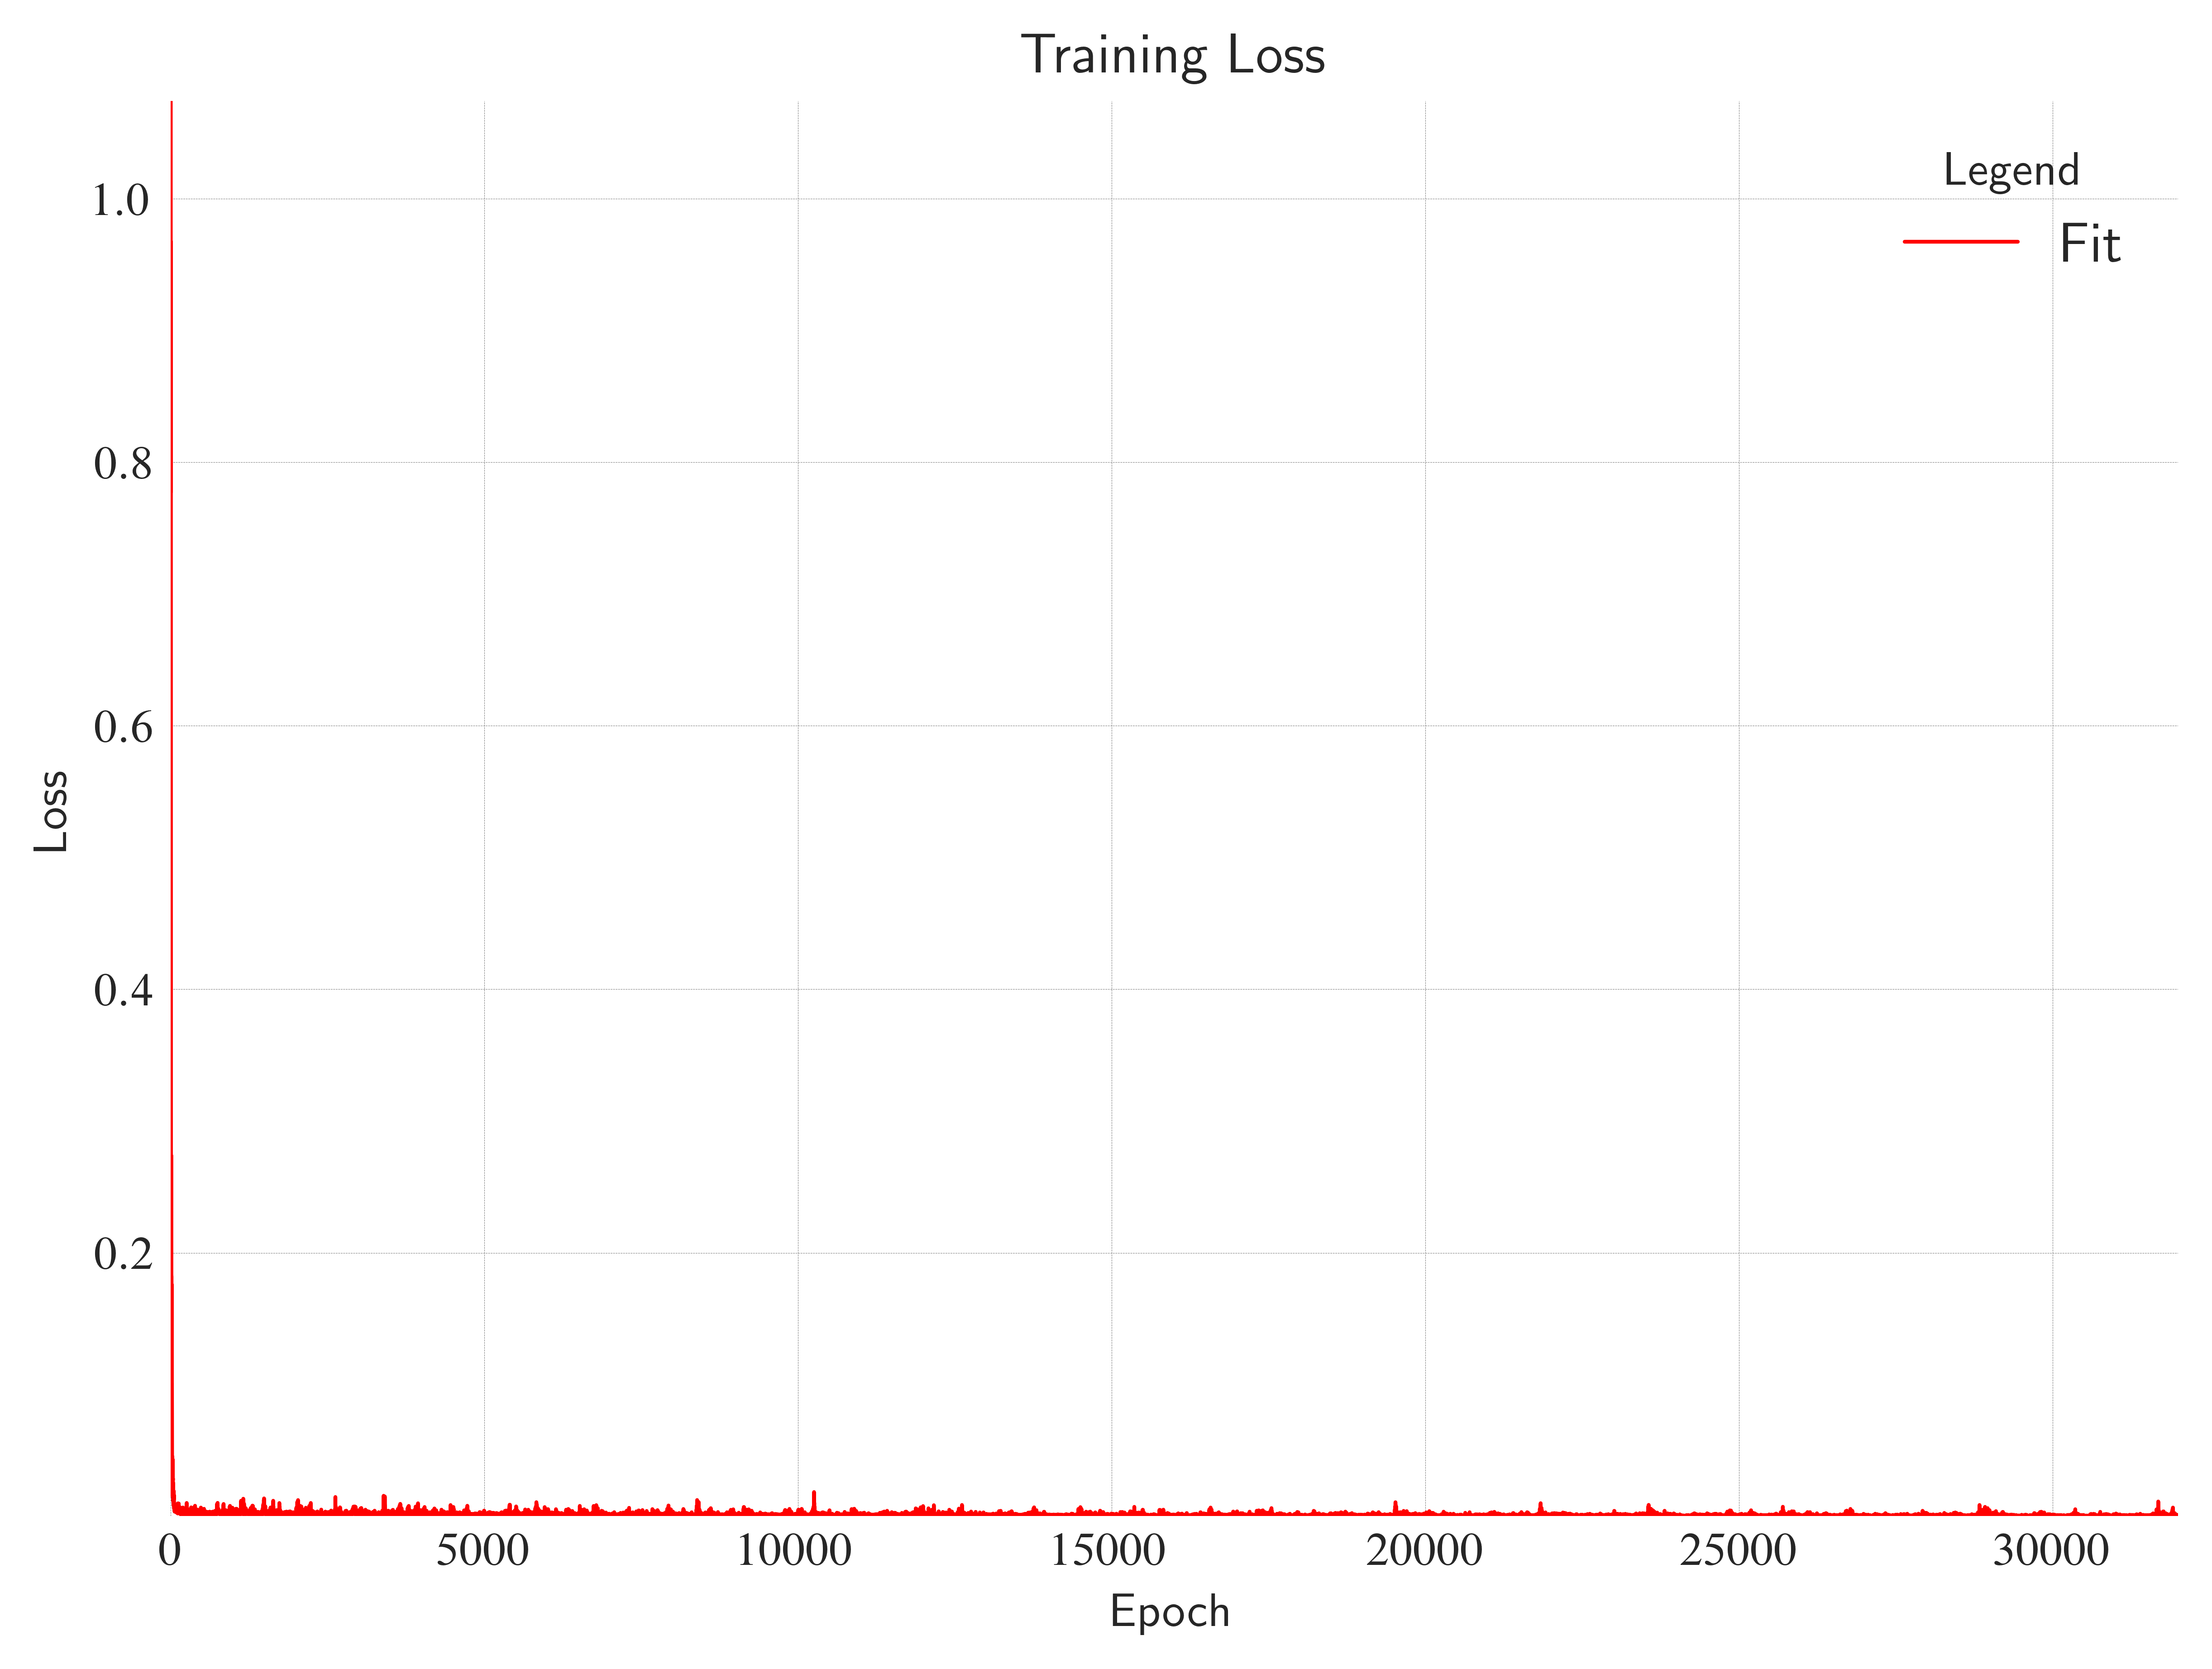
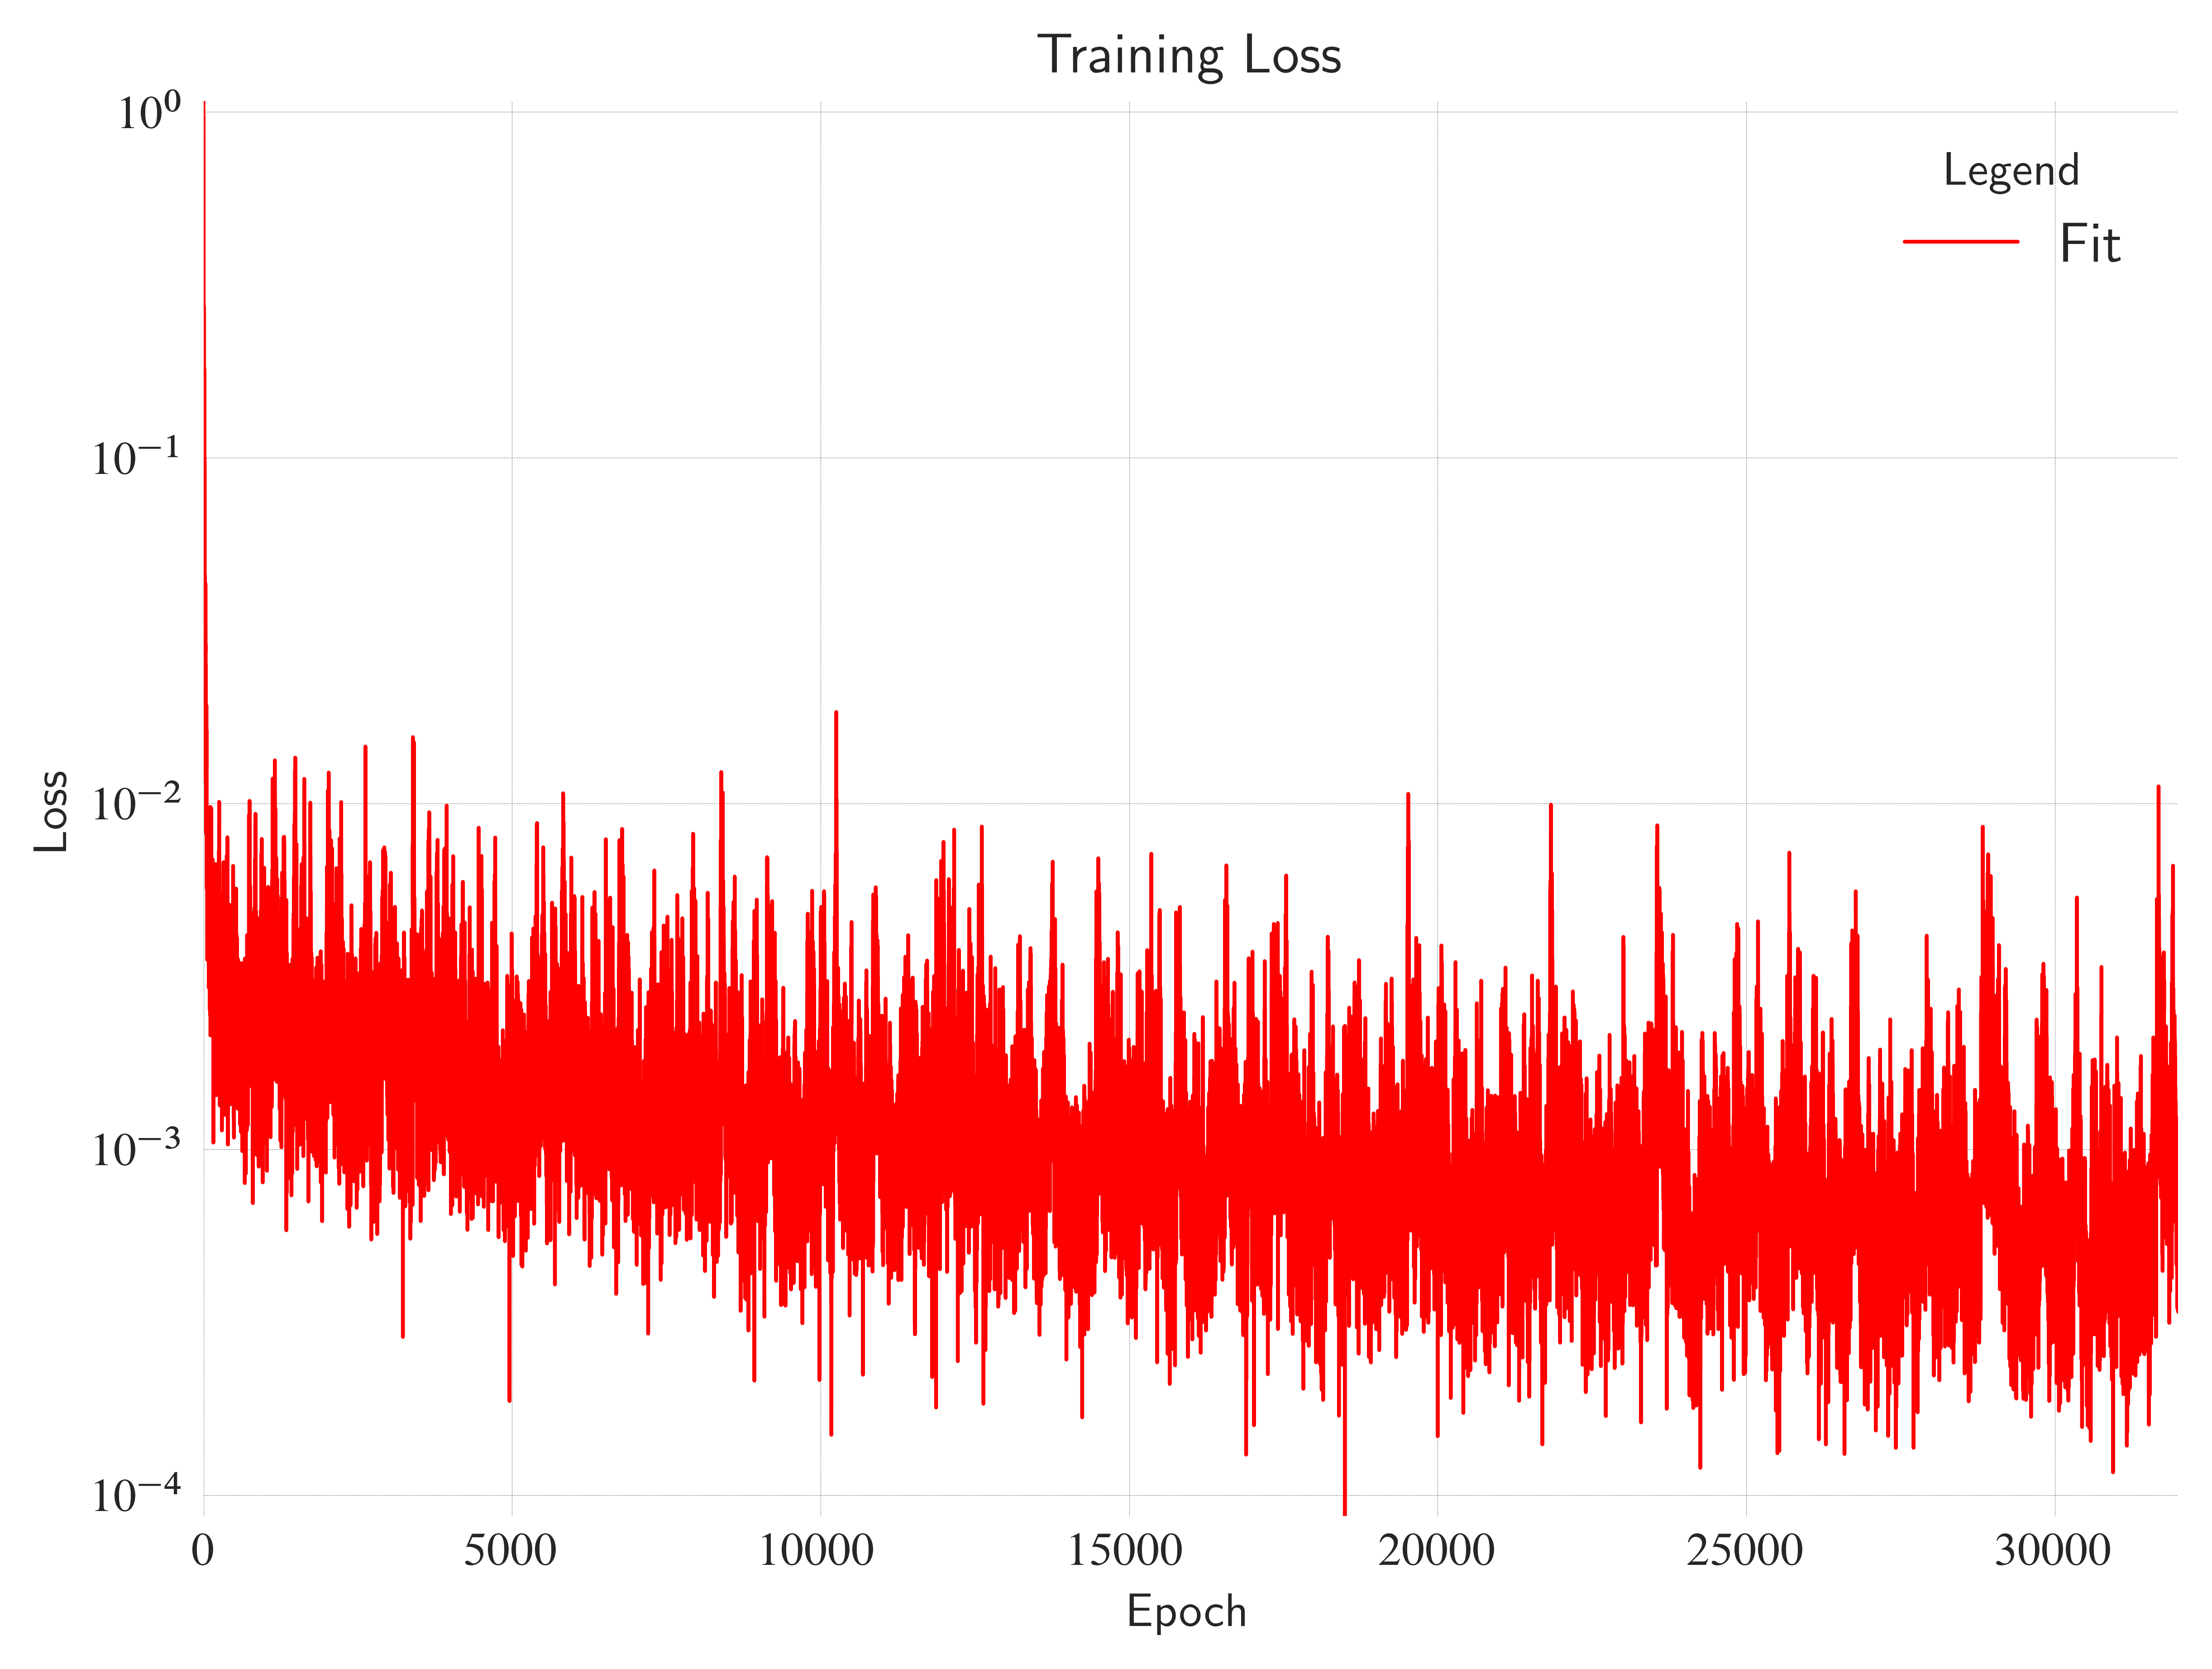
with plt.style.context("seaborn-v0_8-white"):
    fig, ax = plt.subplots(layout="constrained")
    ax.semilogy(
        losses,
        color="red",
        label="Fit",
        linestyle="solid",
        linewidth=0.8,
    )
    ax.grid(c="gray", linewidth=0.1, linestyle="dashed")
    ax.set_xlim(left=0, right=stack(losses).size()[0])
    ax.set_ylim(bottom=stack(losses).min(), top=stack(losses).max())
    ax.set_xlabel(xlabel="Epoch")
    ax.set_ylabel(ylabel="Loss")
    ax.spines["bottom"].set_color("none")
    ax.spines["top"].set_color("none")
    ax.spines["left"].set_color("none")
    ax.spines["right"].set_color("none")
    ax.legend(loc="best", title="Legend", shadow=True, fontsize=12)
    ax.set_title(
        label="Training Loss",
        loc="center",
        wrap=True,
    )
    ax.legend(loc="best", title="Legend", shadow=True, fontsize=12)
    fig.savefig("training_loss.pdf", transparent=True, bbox_inches="tight")
    plt.show()
    fig.clf()