https://
%matplotlib widget
import sys
import numpy as np
import matplotlib.pyplot as plt
from matplotlib.animation import FFMpegWriter, FuncAnimation
from tqdm.notebook import tqdm
1 Introducción
Los métodos de volúmenes finitos son técnicas del análisis numérico el cual surgen de la discretización de una EDP en su forma conservativa.
2 Fundamentos básicos
2.1 Ley de conservación
Una ley de conservación unidimensional es
2.2 Sistemas lineales de leyes de conservación hiperbólicas
2.3 Problema de Cauchy
Si y , entonces .
2.4 Problema de Riemann
donde .
La solución es
2.5 Velocidad de propagación en algunos problemas evolutivos
2.5.1 Problemas parabólicos
2.5.2 Problemas hiperbólicos
3 Métodos de Volúmenes Finitos
Métodos descentrados de primer orden.
3.1 Método de Volúmenes Finitos
El método de volúmenes finitos es conservativo.
3.2 Métodos descentrados
3.2.1 Método descentrado upwind
Si ,
El flujo numérico a lo largo de la recta es
El flujo numérico a lo largo de la recta es
3.2.1 Método descentrado downwind
Si ,
, .
3.3 Método de Godunov
3.3.1 Primera versión
3.3.2 Segunda versión
4 Convergencia, precisión y estabilidad
Upwind
Downwind
FTCS
Lax-Friedrichs
Lax-Wendroff
4.2 Error de truncamiento local y consistencia
4.3 Estabilidad
4.3.1 Condición CFL
4.3.2 Análisis de Estabilidad de Von Neumann
5 Simulaciones numéricas
Introducimos las condiciones de contorno.
5.1 Condiciones de contorno
Extender el dominio computacional para incluir celdas en cada extremo, estas se llaman las celdas fantasmas.
Las condiciones de contorno periódicas,
Si , .
Si , .
5.2 Lenguaje de programación Julia
               _
   _       _ _(_)_     |  Documentation: https://docs.julialang.org
  (_)     | (_) (_)    |
   _ _   _| |_  __ _   |  Type "?" for help, "]?" for Pkg help.
  | | | | | | |/ _` |  |
  | | |_| | | | (_| |  |  Version 1.11.2 (2024-12-01)
 _/ |\__'_|_|_|\__'_|  |
|__/                   |

julia>
5.3 Test numéricos
5.3.1 Primeros test
Ejemplo 1
, , , .
plt.style.use("seaborn-v0_8-white")def U(x):
return np.exp(-np.power(x - 15, 2))x = np.linspace(start=0, stop=20, num=300)
t, Δt = np.linspace(start=0, stop=1, num=51, retstep=True)
c = -1fig, ax = plt.subplots(layout="constrained")
ax.plot(
x,
U(x),
color="red",
label=r"$U_{0}\left(x\right)$",
linestyle="solid",
linewidth=1.0,
)
ax.spines["bottom"].set_color("none")
ax.spines["top"].set_alpha(alpha=0.8)
ax.spines["top"].set_edgecolor(color="gray")
ax.spines["top"].set_linewidth(w=0.5)
ax.spines["left"].set_alpha(alpha=0.8)
ax.spines["left"].set_edgecolor(color="gray")
ax.spines["left"].set_linewidth(w=0.5)
ax.spines["right"].set_alpha(alpha=0.8)
ax.spines["right"].set_edgecolor(color="gray")
ax.spines["right"].set_linewidth(w=0.5)
ax.set_xlim(left=x[0], right=x[-1])
ax.set_ylim(bottom=0, top=1)
ax.set_title(
label=r"Condición inicial $U_{0}\left(x\right)=e^{-{\left(x-15\right)}^{2}}$",
loc="center",
)
ax.legend(loc="best")Loading...
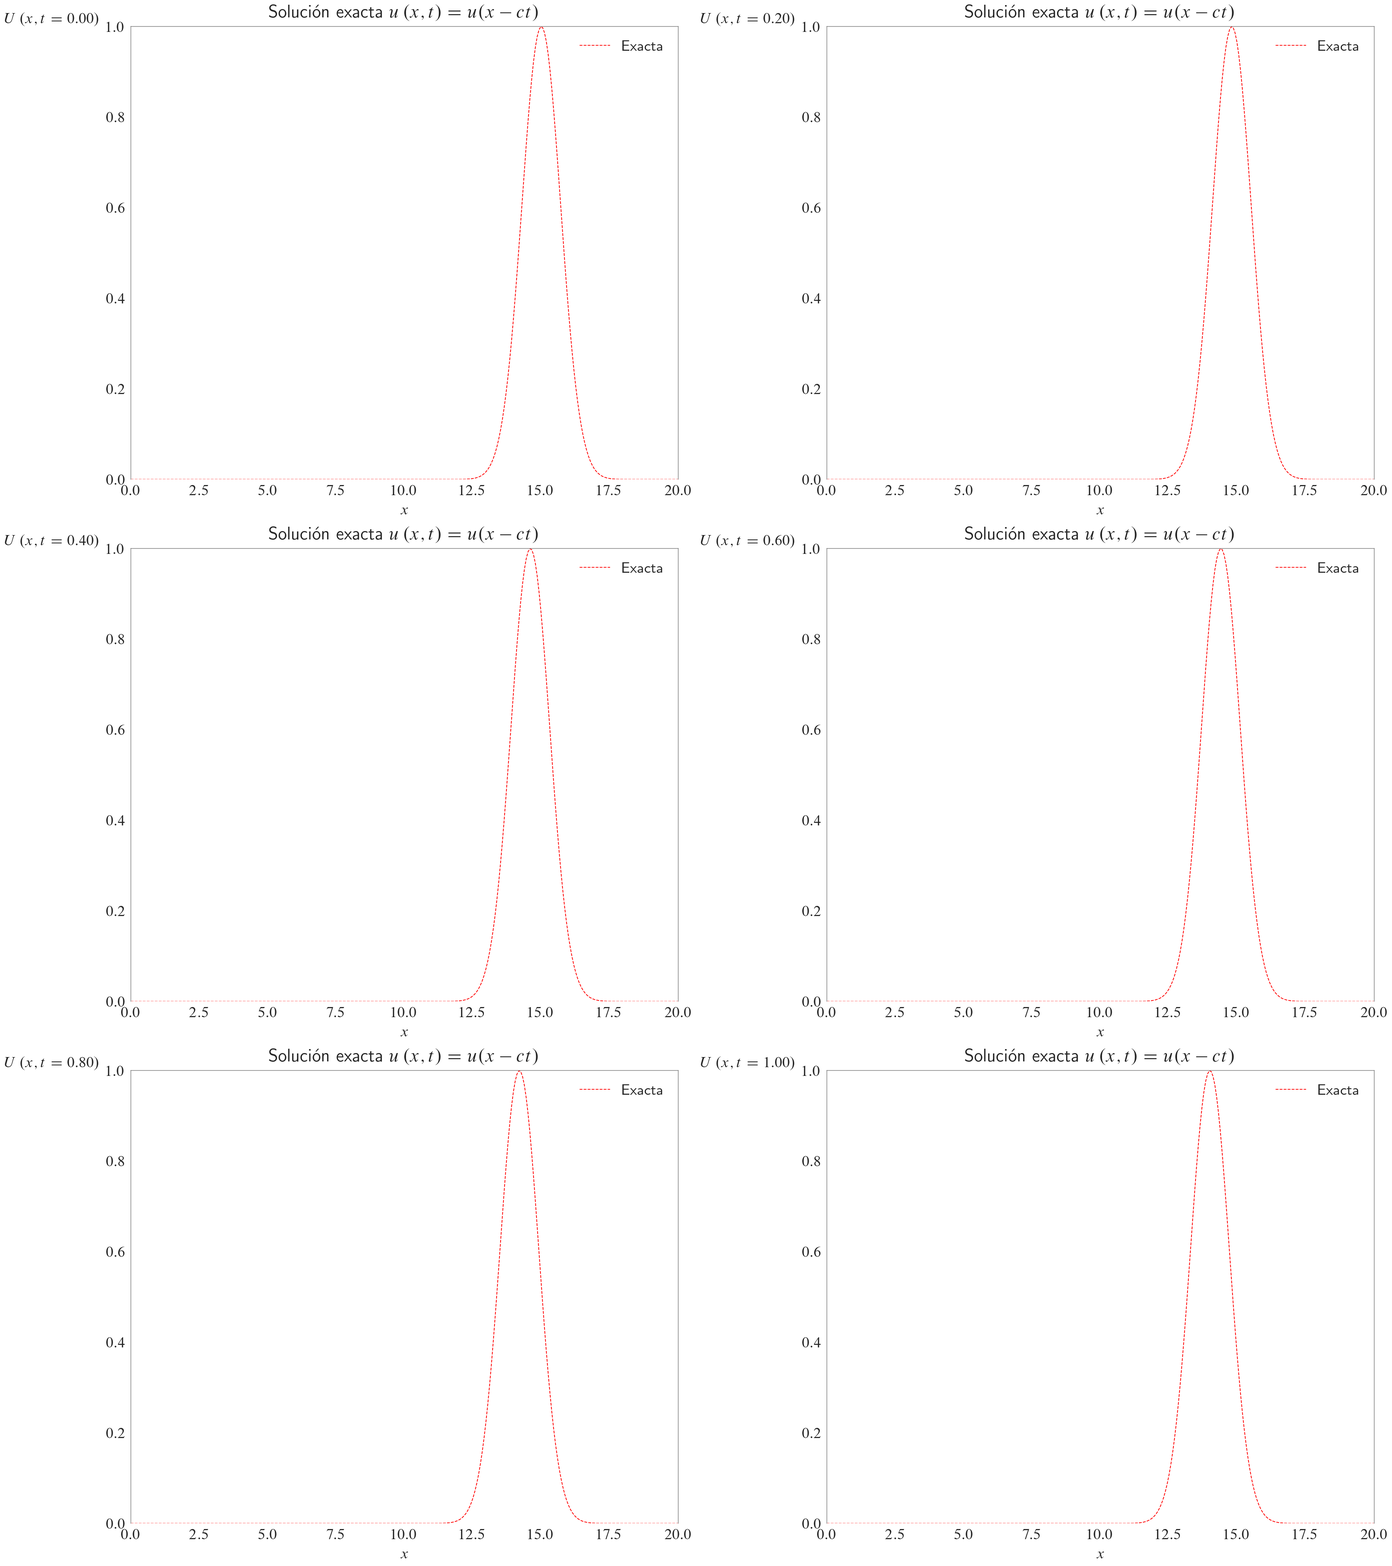
Solución exacta
fig, ax = plt.subplots(layout="constrained")
(ln,) = ax.plot(
    [],
    [],
    color="red",
    label="Exacta",
    linestyle="dashed",
    linewidth=0.5,
)
ax.spines["bottom"].set_color("none")
ax.spines["top"].set_alpha(alpha=0.8)
ax.spines["top"].set_edgecolor(color="gray")
ax.spines["top"].set_linewidth(w=0.5)
ax.spines["left"].set_alpha(alpha=0.8)
ax.spines["left"].set_edgecolor(color="gray")
ax.spines["left"].set_linewidth(w=0.5)
ax.spines["right"].set_alpha(alpha=0.8)
ax.spines["right"].set_edgecolor(color="gray")
ax.spines["right"].set_linewidth(w=0.5)
ax.set_xlabel(xlabel=r"$x$")
ax.set_xlim(left=x[0], right=x[-1])
ax.set_ylim(bottom=0, top=1)
ax.set_title(label=r"Solución exacta $u\left(x,t\right)=u(x-ct)$")
ax.legend(loc="best")

def init():
    ln.set_data(x, U(x))

    return (ln,)


def update(frame):
    ln.set_data(x, U(x=x - c * (t[0] + frame * Δt)))
    ax.set_ylabel(
        ylabel=rf"$U\left(x, t={frame * Δt:.2f}\right)$", loc="top", rotation=0
    )

    return (ln,)


anim = FuncAnimation(
    fig=fig,
    func=update,
    frames=tqdm(iterable=range(t.size), file=sys.stdout, colour="green"),
    interval=1,
    init_func=init,
    blit=True,
).save(
    filename="exactgaussian.gif",
    writer=FFMpegWriter(
        fps=90,
        codec="libx265",
        metadata={
            "subject": "Numerical Analysis",
            "title": "Exact solution Gaussian Function",
            "author": "Gloria Almozara Sainz",
            "genre": "Mathematics",
            "copyright": "2025",
            "srcform": "Matplotlib 3.9.3",
            "comment": "Numerical Simulation for advection PDE",
        },
    ),
    dpi=300,
    savefig_kwargs={"transparent": True, "facecolor": "none"},
)
plt.close()
Loading...
x, Δx = np.linspace(start=0, stop=20, num=201, retstep=True)
c = -1
cfl = c * Δt / Δx
fig, ax = plt.subplots(layout="constrained")
(ln,) = ax.plot(
[],
[],
color="DarkBlue",
label="Exacta",
linestyle="dashed",
linewidth=0.5,
)
ln1 = ax.scatter(
x=[],
y=[],
c="blue",
label=rf"CFL $={cfl:.1f}$, $\Delta x={Δx:.3f}$",
s=0.4,
)
ax.set_xlabel(xlabel=r"$x$")
ax.set_xlim(left=x[0], right=x[-1])
ax.set_ylim(bottom=0, top=1)
ax.spines["bottom"].set_color("none")
ax.spines["top"].set_alpha(alpha=0.8)
ax.spines["top"].set_edgecolor(color="gray")
ax.spines["top"].set_linewidth(w=0.5)
ax.spines["left"].set_alpha(alpha=0.8)
ax.spines["left"].set_edgecolor(color="gray")
ax.spines["left"].set_linewidth(w=0.5)
ax.spines["right"].set_alpha(alpha=0.8)
ax.spines["right"].set_edgecolor(color="gray")
ax.spines["right"].set_linewidth(w=0.5)
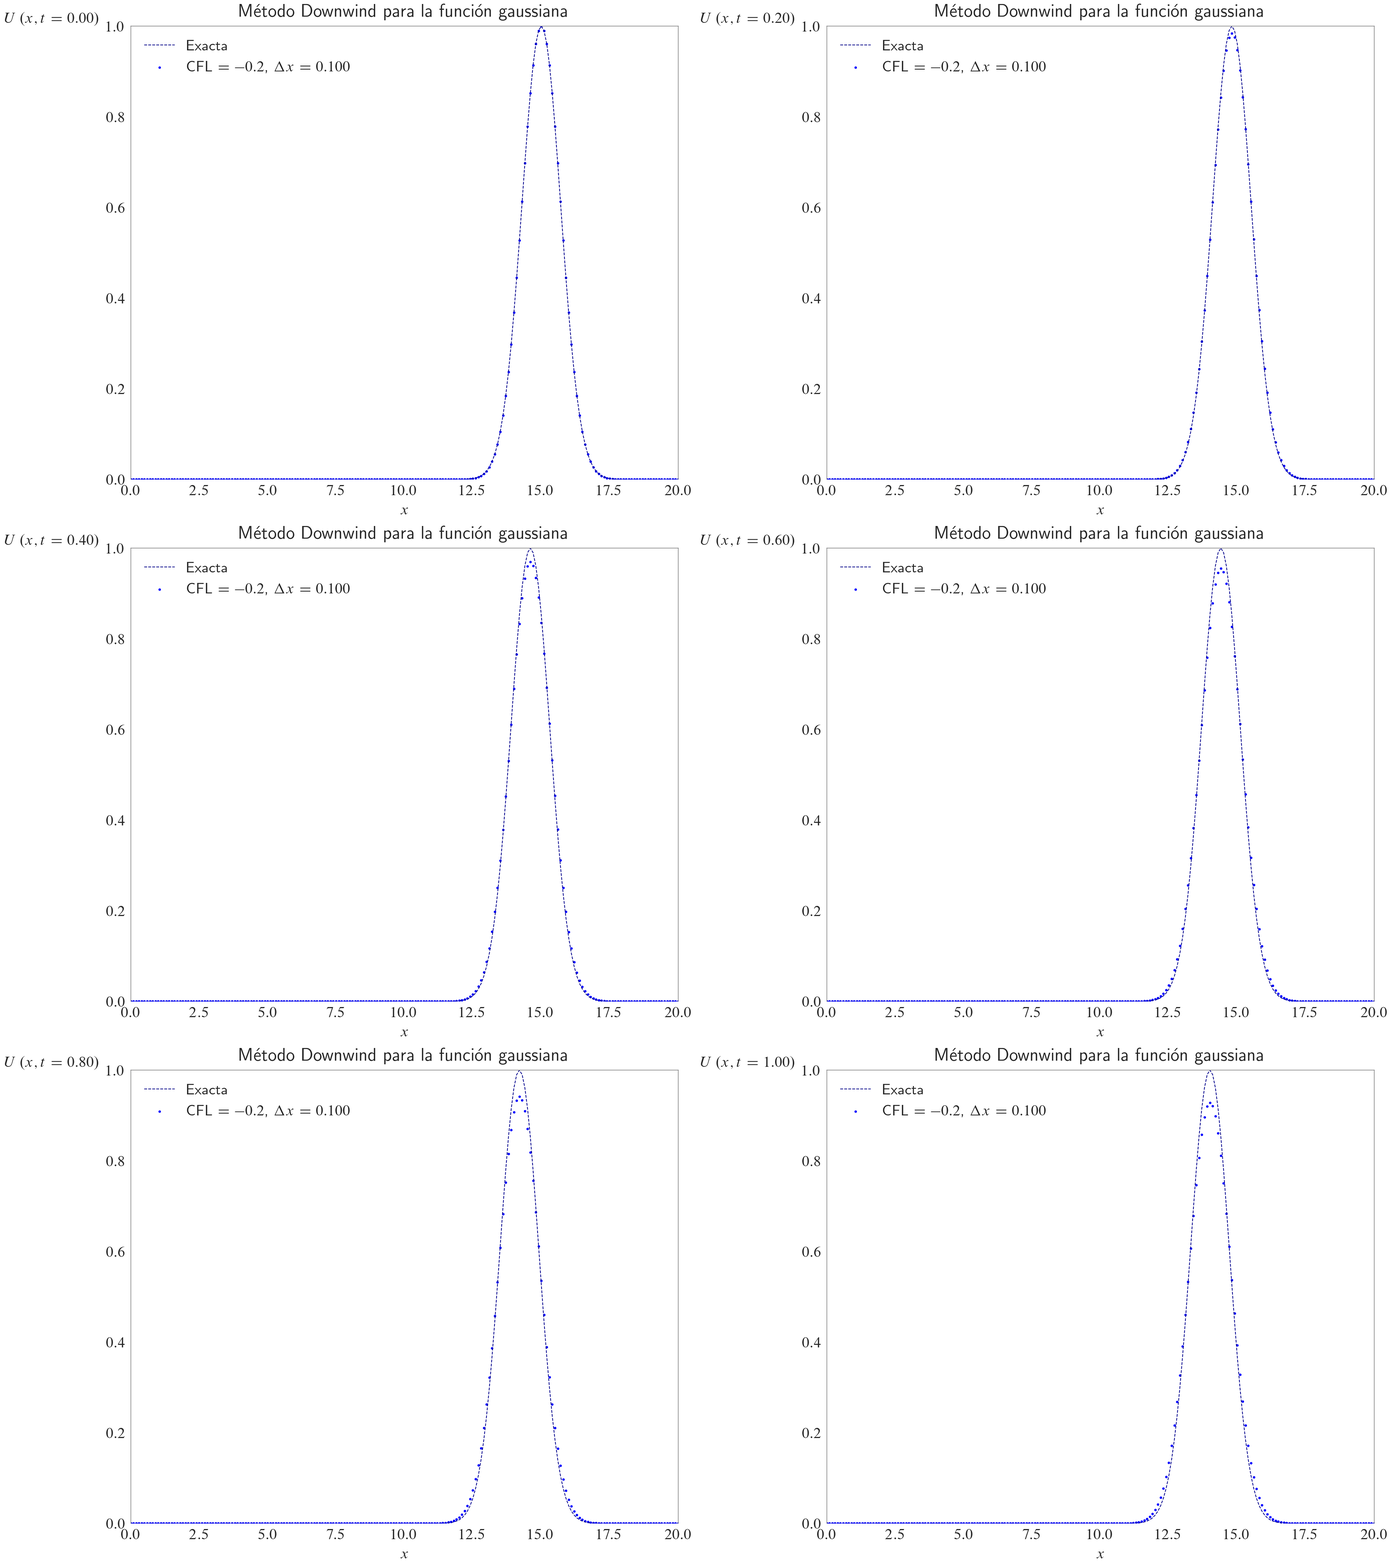
ax.set_title(label="Método Downwind para la función gaussiana", loc="center")
ax.legend(loc="best")
U1 = U(x=x)
def init():
ln.set_data(x, U(x))
ln1.set_offsets(offsets=np.column_stack([x, U1]))
return (ln,)
def update(frame):
ln1.set_offsets(offsets=np.column_stack([x, U1]))
ln.set_data(x, U(x=x - c * frame * Δt))
U1[1:] -= cfl * (np.roll(U1, -1) - U1)[1:]
ax.set_ylabel(
ylabel=rf"$U\left(x, t={frame * Δt:.2f}\right)$", loc="top", rotation=0
)
return (ln,)
anim = FuncAnimation(
fig=fig,
func=update,
frames=tqdm(iterable=range(t.size), file=sys.stdout, colour="green"),
interval=1,
init_func=init,
blit=True,
).save(
filename="downwindgaussian.gif",
writer=FFMpegWriter(
fps=90,
codec="libx265",
metadata={
"subject": "Numerical Analysis",
"title": "Exact solution",
"author": "Gloria Almozara Sainz",
"genre": "Mathematics",
"copyright": "2025",
"srcform": "Matplotlib 3.9.3",
"comment": "Numerical Simulation for advection PDE",
},
),
dpi=300,
savefig_kwargs={"transparent": True, "facecolor": "none"},
)
plt.close()Loading...
fig, ax = plt.subplots(layout="constrained")

(ln,) = ax.plot(
    [],
    [],
    color="DarkBlue",
    label="Exacta",
    linestyle="dashed",
    linewidth=0.5,
)

ln1 = ax.scatter(
    x=[],
    y=[],
    c="blue",
    label=rf"CFL $={cfl:.1f}$, $\Delta x={Δx:.3f}$",
    s=0.4,
)
ax.set_xlabel(xlabel=r"$x$")
ax.set_xlim(left=x[0], right=x[-1])
ax.set_ylim(bottom=0, top=1)
ax.spines["bottom"].set_color("none")
ax.spines["top"].set_alpha(alpha=0.8)
ax.spines["top"].set_edgecolor(color="gray")
ax.spines["top"].set_linewidth(w=0.5)
ax.spines["left"].set_alpha(alpha=0.8)
ax.spines["left"].set_edgecolor(color="gray")
ax.spines["left"].set_linewidth(w=0.5)
ax.spines["right"].set_alpha(alpha=0.8)
ax.spines["right"].set_edgecolor(color="gray")
ax.spines["right"].set_linewidth(w=0.5)
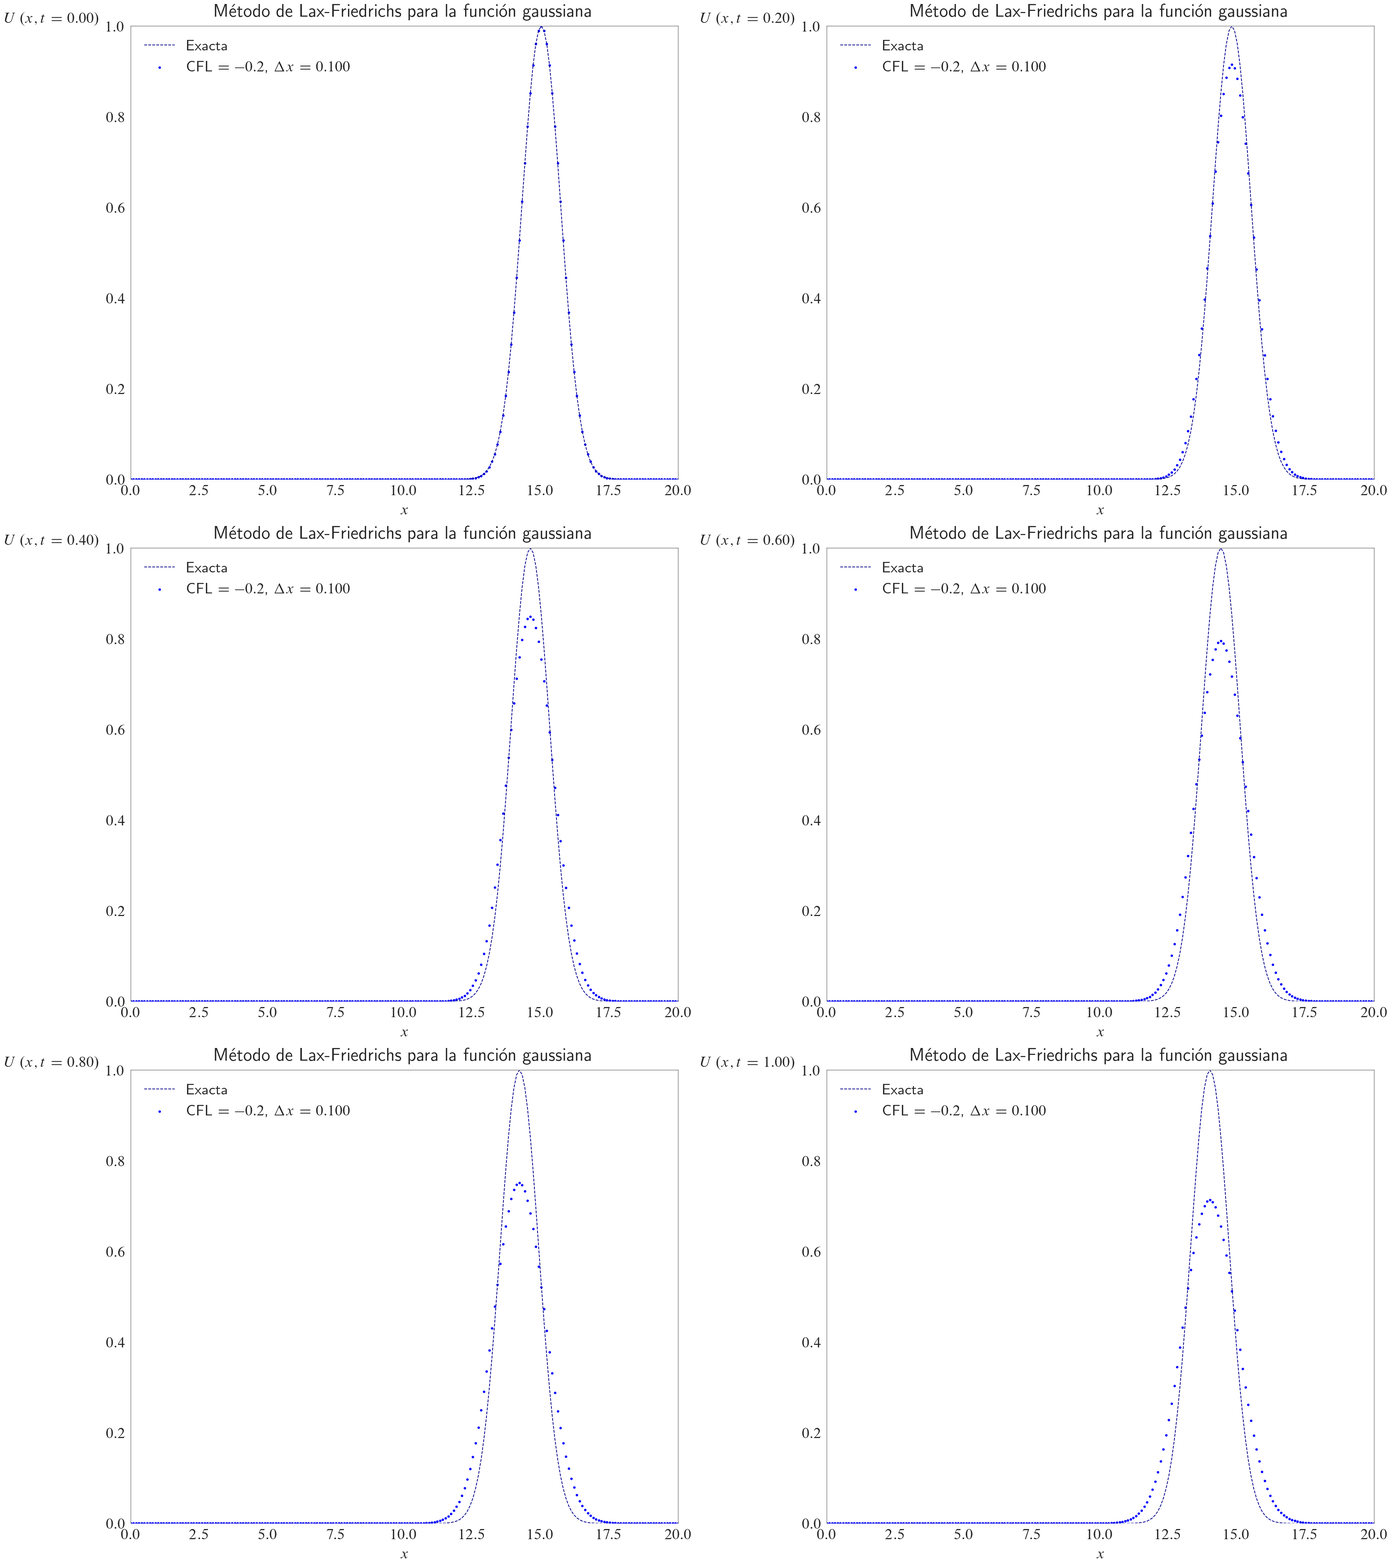
ax.set_title(label="Método de Lax-Friedrichs para la función gaussiana", loc="center")
ax.legend(loc="best")

U1 = U(x=x)


def init():
    ln.set_data(x, U(x))
    ln1.set_offsets(offsets=np.column_stack([x, U1]))

    return (ln,)


def update(frame):
    ln1.set_offsets(offsets=np.column_stack([x, U1]))
    ln.set_data(x, U(x=x - c * frame * Δt))
    U1[1:-1] = (
        0.5 * (np.roll(U1, -1) + np.roll(U1, 1))[1:-1]
        - 0.5 * cfl * (np.roll(U1, -1) - np.roll(U1, 1))[1:-1]
    )
    ax.set_ylabel(
        ylabel=rf"$U\left(x, t={frame * Δt:.2f}\right)$", loc="top", rotation=0
    )

    return (ln,)


anim = FuncAnimation(
    fig=fig,
    func=update,
    frames=tqdm(iterable=range(t.size), file=sys.stdout, colour="green"),
    interval=1,
    init_func=init,
    blit=True,
).save(
    filename="lax-friedrichsgaussiana.gif",
    writer=FFMpegWriter(
        fps=90,
        codec="libx265",
        metadata={
            "subject": "Numerical Analysis",
            "title": "Exact solution",
            "author": "Gloria Almozara Sainz",
            "genre": "Mathematics",
            "copyright": "2025",
            "srcform": "Matplotlib 3.9.3",
            "comment": "Numerical Simulation for advection PDE",
        },
    ),
    dpi=300,
    savefig_kwargs={"transparent": True, "facecolor": "none"},
)
plt.close()
Loading...
Método de Lax-Wendroff
fig, ax = plt.subplots(layout="constrained")

(ln,) = ax.plot(
    [],
    [],
    color="DarkBlue",
    label="Exacta",
    linestyle="dashed",
    linewidth=0.5,
)

ln1 = ax.scatter(
    x=[],
    y=[],
    c="blue",
    label=rf"CFL $={cfl:.1f}$, $\Delta x={Δx:.3f}$",
    s=0.4,
)
ax.spines["bottom"].set_color("none")
ax.spines["top"].set_alpha(alpha=0.8)
ax.spines["top"].set_edgecolor(color="gray")
ax.spines["top"].set_linewidth(w=0.5)
ax.spines["left"].set_alpha(alpha=0.8)
ax.spines["left"].set_edgecolor(color="gray")
ax.spines["left"].set_linewidth(w=0.5)
ax.spines["right"].set_alpha(alpha=0.8)
ax.spines["right"].set_edgecolor(color="gray")
ax.spines["right"].set_linewidth(w=0.5)
ax.set_xlabel(xlabel=r"$x$")
ax.set_xlim(left=x[0], right=x[-1])
ax.set_ylim(bottom=0, top=1)
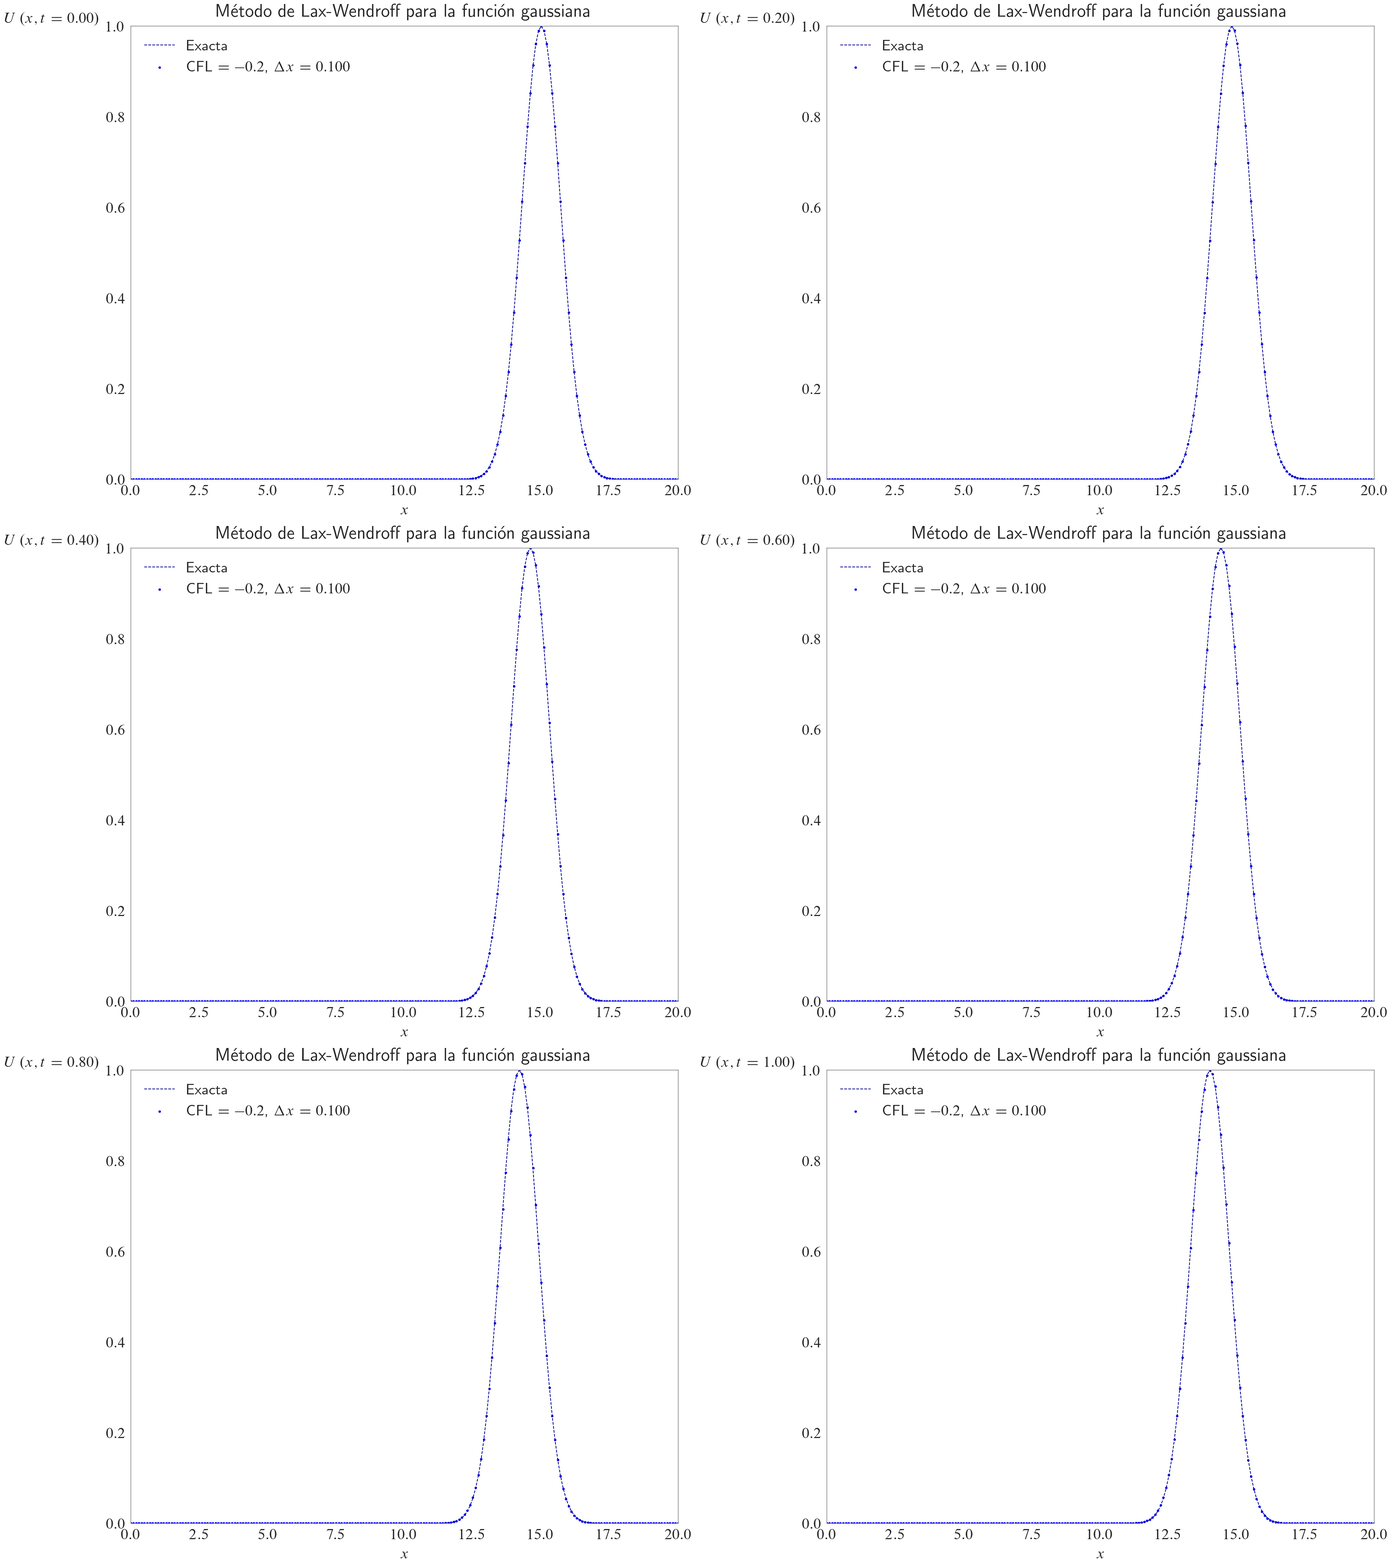
ax.set_title(label="Método de Lax-Wendroff para la función gaussiana", loc="center")
ax.legend(loc="best")

U1 = U(x=x)


def init():
    ln.set_data(x, U(x))
    ln1.set_offsets(offsets=np.column_stack([x, U1]))

    return (ln,)


def update(frame):
    ln1.set_offsets(offsets=np.column_stack([x, U1]))
    ln.set_data(x, U(x=x - c * frame * Δt))
    U1[1:-1] -= (
        0.5 * cfl * (np.roll(U1, -1) - np.roll(U1, 1))[1:-1]
        - 0.5 * cfl**2 * (np.roll(U1, -1) - 2 * U1 + np.roll(U1, 1))[1:-1]
    )
    ax.set_ylabel(
        ylabel=rf"$U\left(x, t={frame * Δt:.2f}\right)$", loc="top", rotation=0
    )

    return (ln,)


anim = FuncAnimation(
    fig=fig,
    func=update,
    frames=tqdm(iterable=range(t.size), file=sys.stdout, colour="green"),
    interval=1,
    init_func=init,
    blit=True,
).save(
    filename="lax-wendroffgaussiana.gif",
    writer=FFMpegWriter(
        fps=90,
        codec="libx265",
        metadata={
            "subject": "Numerical Analysis",
            "title": "Exact solution",
            "author": "Gloria Almozara Sainz",
            "genre": "Mathematics",
            "copyright": "2025",
            "srcform": "Matplotlib 3.9.3",
            "comment": "Numerical Simulation for advection PDE",
        },
    ),
    dpi=300,
    savefig_kwargs={"transparent": True, "facecolor": "none"},
)
plt.close()
Loading...
x, Δx = np.linspace(start=0, stop=30, num=251, retstep=True)
t, Δt = np.linspace(start=0, stop=1, num=51, retstep=True)
c = 1
cfl = c * Δt / Δx
def U(x, U_left=2, U_right=1, x0=15):
return U_left + (U_right - U_left) * np.heaviside(x - x0, 0)fig, ax = plt.subplots(layout="constrained")
ax.plot(
x,
U(x),
color="red",
label=r"$U_{0}\left(x\right)$",
linestyle="solid",
linewidth=1.0,
)
ax.spines["bottom"].set_color("none")
ax.spines["top"].set_color("none")
ax.spines["left"].set_alpha(alpha=0.8)
ax.spines["left"].set_edgecolor(color="gray")
ax.spines["left"].set_linewidth(w=0.5)
ax.spines["right"].set_alpha(alpha=0.8)
ax.spines["right"].set_edgecolor(color="gray")
ax.spines["right"].set_linewidth(w=0.5)
ax.set_title(label=r"Condición inicial $U_{0}=2-H\left(x-15\right)$", loc="center")
ax.set_xlim(left=x[0], right=x[-1])
ax.set_ylim(bottom=U(x).min(), top=U(x).max())
ax.legend(loc="best")Loading...
fig, ax = plt.subplots(layout="constrained")
(ln,) = ax.plot(
    [],
    [],
    color="red",
    label="Exacta",
    linestyle="dashed",
    linewidth=0.5,
)
ax.spines["bottom"].set_color("none")
ax.spines["top"].set_color("none")
ax.spines["left"].set_alpha(alpha=0.8)
ax.spines["left"].set_edgecolor(color="gray")
ax.spines["left"].set_linewidth(w=0.5)
ax.spines["right"].set_alpha(alpha=0.8)
ax.spines["right"].set_edgecolor(color="gray")
ax.spines["right"].set_linewidth(w=0.5)
ax.set_xlabel(xlabel=r"$x$")
ax.set_xlim(left=x[0], right=x[-1])
ax.set_ylim(bottom=U(x).min(), top=U(x).max())
ax.set_title(label=r"Solución exacta $u\left(x,t\right)=u(x-ct)$")
ax.legend(loc="best")

def init():
    ln.set_data(x, U(x))

    return (ln,)


def update(frame):
    ln.set_data(x, U(x=x - c * (t[0] + frame * Δt)))
    ax.set_ylabel(
        ylabel=rf"$U\left(x, t={frame * Δt:.2f}\right)$", loc="top", rotation=0
    )

    return (ln,)


anim = FuncAnimation(
    fig=fig,
    func=update,
    frames=tqdm(iterable=range(t.size), file=sys.stdout, colour="green"),
    interval=1,
    init_func=init,
    blit=True,
).save(
    filename="exactheaviside.gif",
    writer=FFMpegWriter(
        fps=90,
        codec="libx265",
        metadata={
            "subject": "Numerical Analysis",
            "title": "Exact solution",
            "author": "Gloria Almozara Sainz",
            "genre": "Mathematics",
            "copyright": "2025",
            "srcform": "Matplotlib 3.9.3",
            "comment": "Numerical Simulation for advection PDE",
        },
    ),
    dpi=300,
    savefig_kwargs={"transparent": True, "facecolor": "none"},
)
plt.close()
Loading...
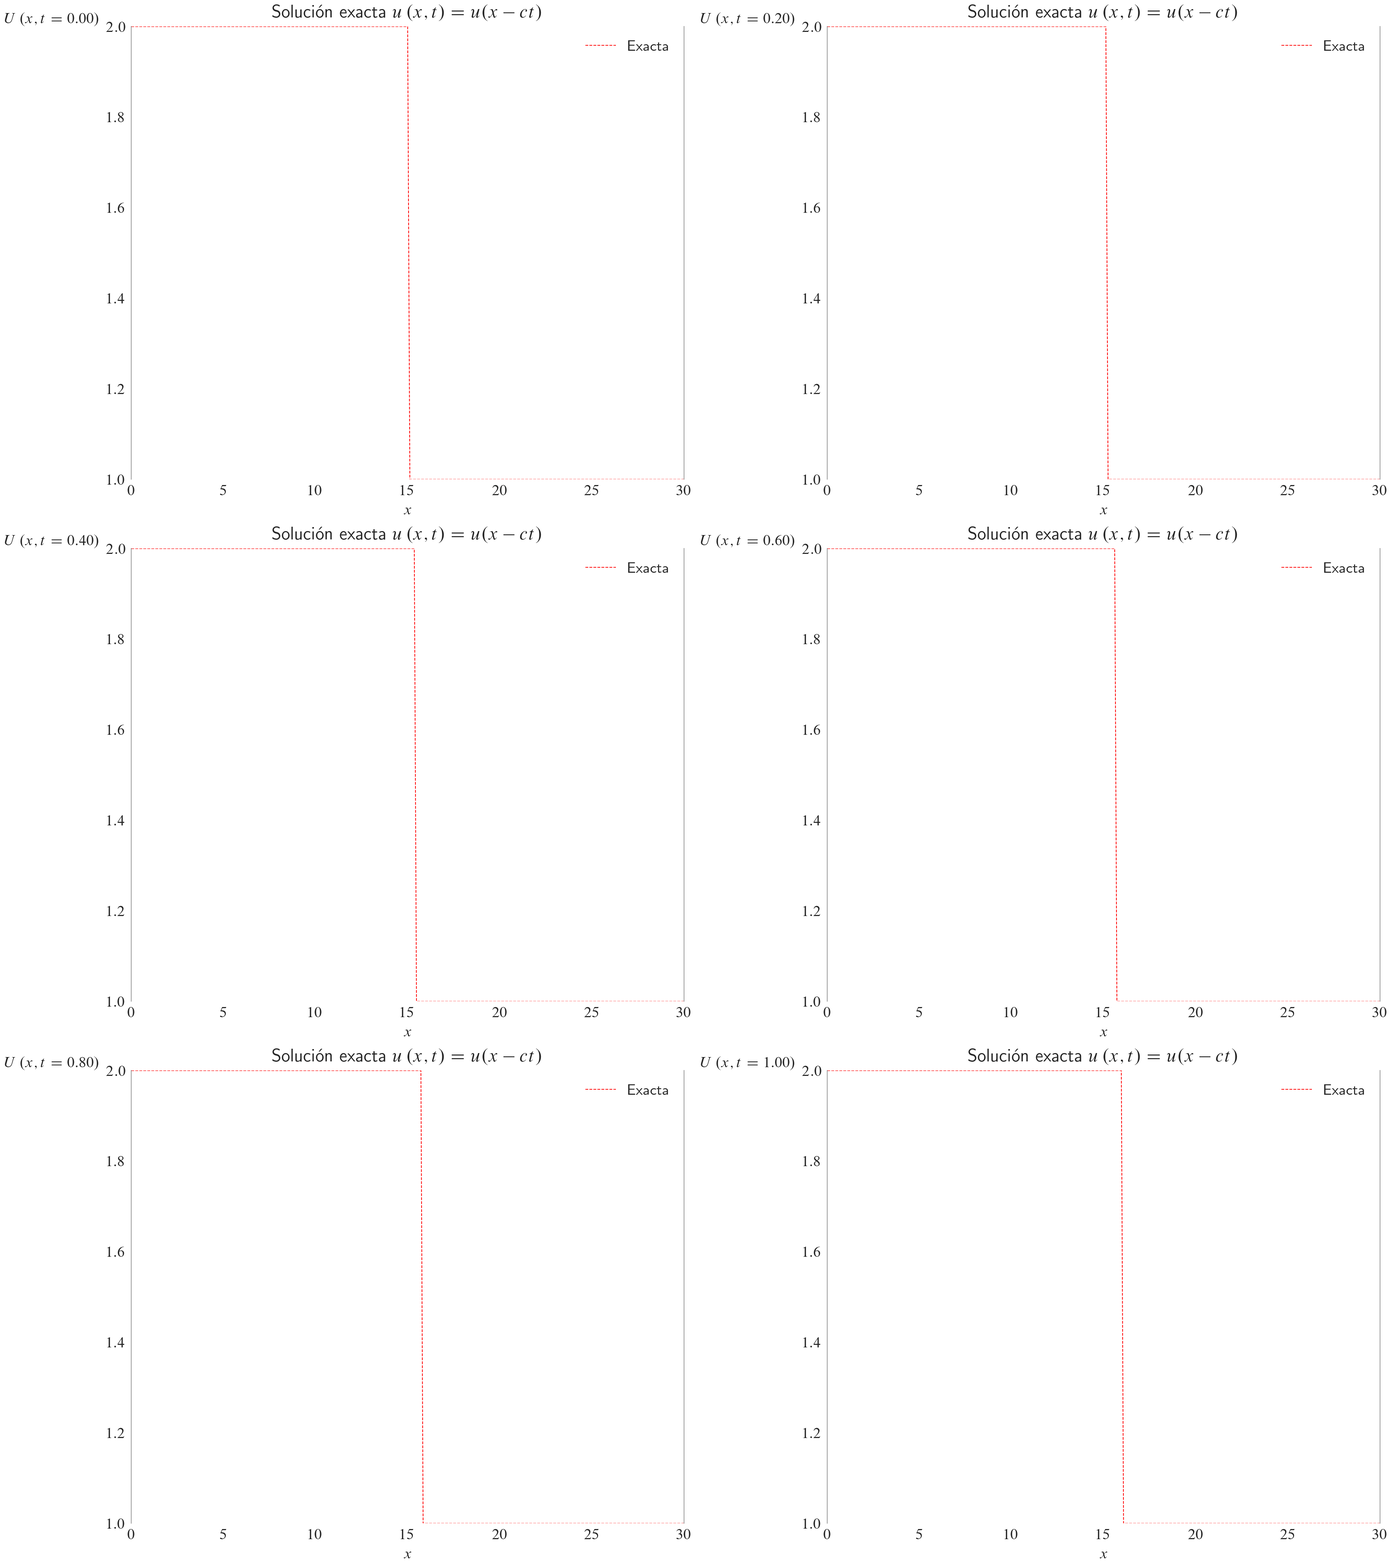
fig, ax = plt.subplots(layout="constrained")

(ln,) = ax.plot(
    [],
    [],
    color="DarkBlue",
    label="Exacta",
    linestyle="dashed",
    linewidth=0.5,
)
ln1 = ax.scatter(
    x=[],
    y=[],
    c="blue",
    label=rf"CFL $={cfl:.1f}$, $\Delta x={Δx:.3f}$",
    s=0.4,
)
ax.spines["bottom"].set_color("none")
ax.spines["top"].set_color("none")
ax.spines["left"].set_alpha(alpha=0.8)
ax.spines["left"].set_edgecolor(color="gray")
ax.spines["left"].set_linewidth(w=0.5)
ax.spines["right"].set_alpha(alpha=0.8)
ax.spines["right"].set_edgecolor(color="gray")
ax.spines["right"].set_linewidth(w=0.5)
ax.set_xlabel(xlabel=r"$x$")
ax.set_xlim(left=x[0], right=x[-1])
ax.set_ylim(bottom=U(x).min(), top=U(x).max())
ax.set_title(label="Método Upwind para un problema de Riemann", loc="center")
ax.legend(loc="best")

U1 = U(x=x)


def init():
    ln.set_data(x, U(x))
    ln1.set_offsets(offsets=np.column_stack([x, U1]))

    return (ln,)


def update(frame):
    ln1.set_offsets(offsets=np.column_stack([x, U1]))
    ln.set_data(x, U(x=x - c * frame * Δt))
    U1[1:] -= cfl * (U1 - np.roll(U1, 1))[1:]
    ax.set_ylabel(
        ylabel=rf"$U\left(x, t={frame * Δt:.2f}\right)$", loc="top", rotation=0
    )

    return (ln,)


anim = FuncAnimation(
    fig=fig,
    func=update,
    frames=tqdm(iterable=range(t.size), file=sys.stdout, colour="green"),
    interval=1,
    init_func=init,
    blit=True,
).save(
    filename="upwindheaviside.gif",
    writer=FFMpegWriter(
        fps=90,
        codec="libx265",
        metadata={
            "subject": "Numerical Analysis",
            "title": "Exact solution",
            "author": "Gloria Almozara Sainz",
            "genre": "Mathematics",
            "copyright": "2025",
            "srcform": "Matplotlib 3.9.3",
            "comment": "Numerical Simulation for advection PDE",
        },
    ),
    dpi=300,
    savefig_kwargs={"transparent": True, "facecolor": "none"},
)
plt.close()
Loading...
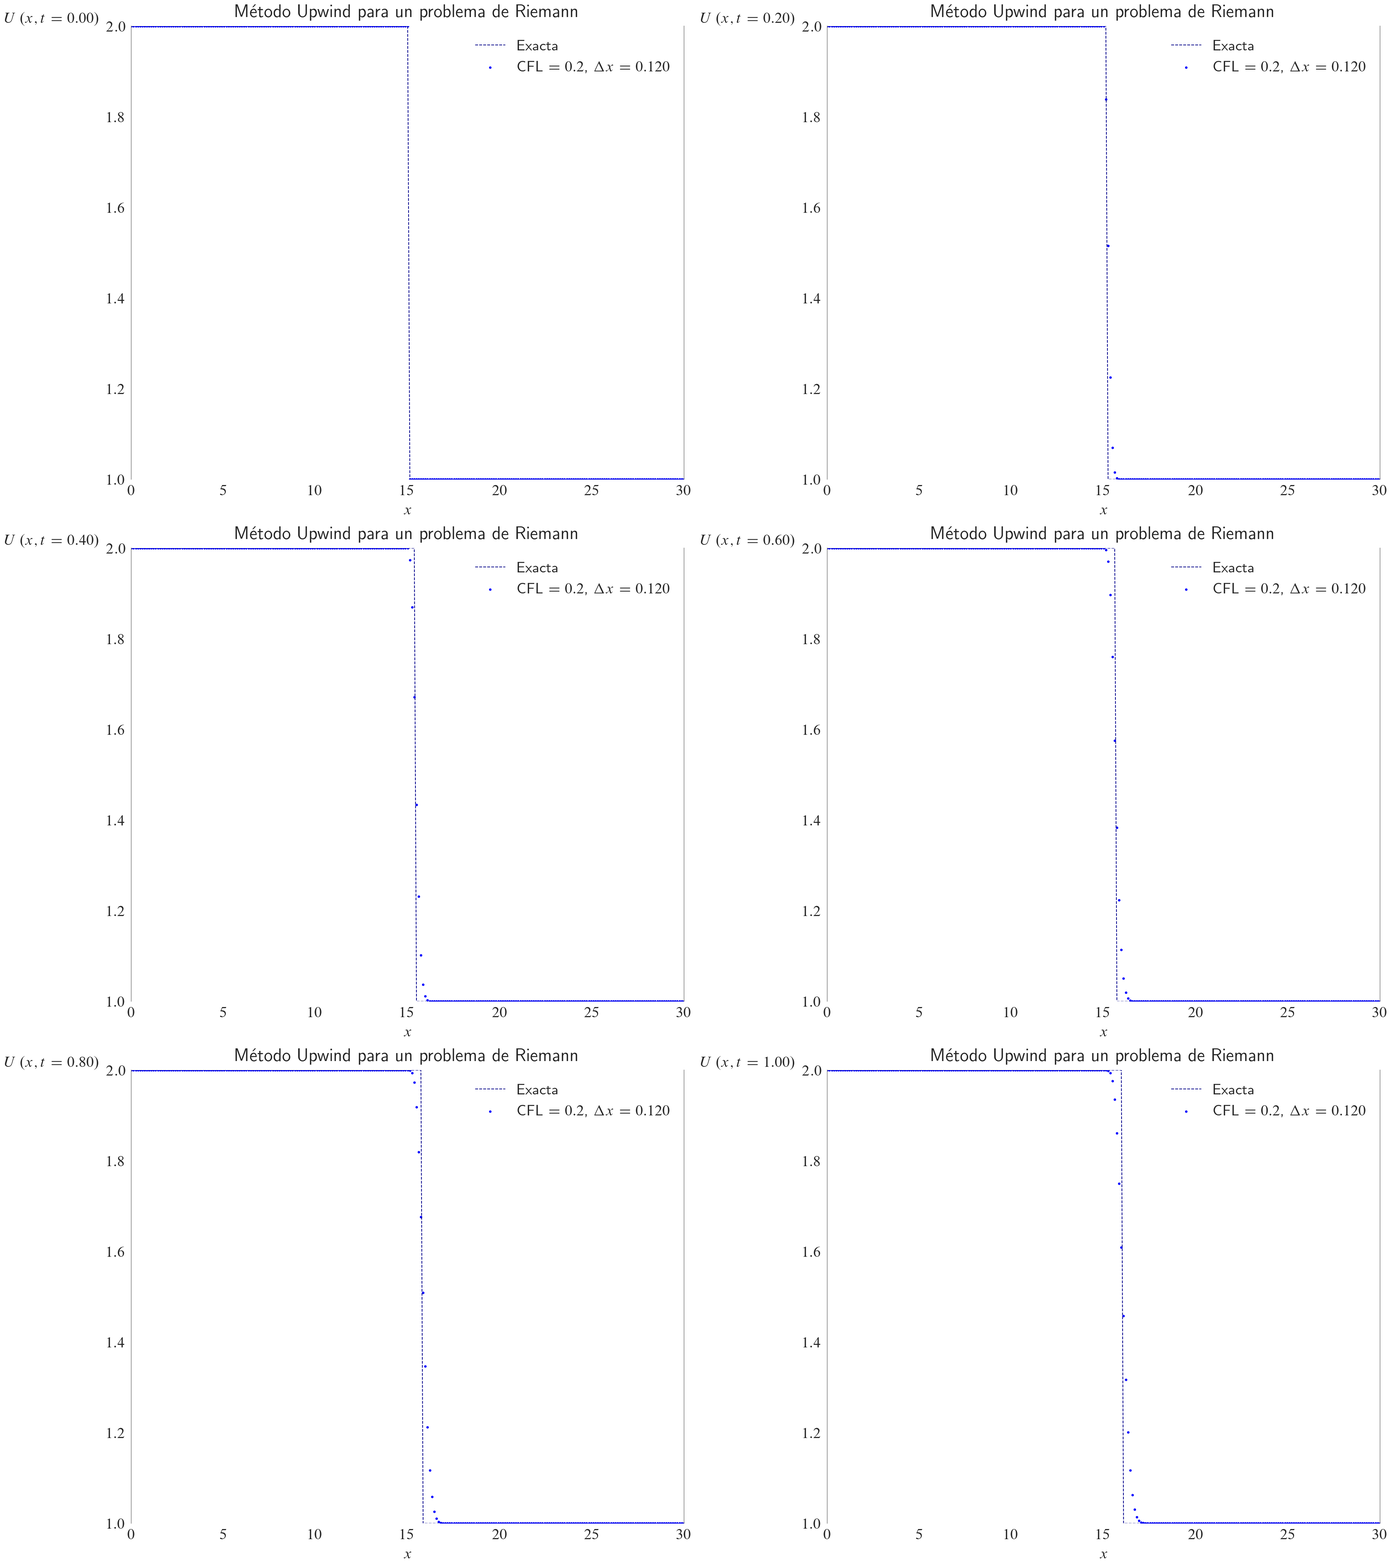
fig, ax = plt.subplots(layout="constrained")

(ln,) = ax.plot(
    [],
    [],
    color="DarkBlue",
    label="Exacta",
    linestyle="dashed",
    linewidth=0.5,
)
ln1 = ax.scatter(
    x=[],
    y=[],
    c="blue",
    label=rf"CFL $={cfl:.1f}$, $\Delta x={Δx:.3f}$",
    s=0.4,
)
ax.spines["bottom"].set_color("none")
ax.spines["top"].set_color("none")
ax.spines["left"].set_alpha(alpha=0.8)
ax.spines["left"].set_edgecolor(color="gray")
ax.spines["left"].set_linewidth(w=0.5)
ax.spines["right"].set_alpha(alpha=0.8)
ax.spines["right"].set_edgecolor(color="gray")
ax.spines["right"].set_linewidth(w=0.5)
ax.set_xlabel(xlabel=r"$x$")
ax.set_xlim(left=x[0], right=x[-1])
ax.set_ylim(bottom=U(x).min(), top=U(x).max())
ax.set_title(label="Método de Lax-Friedrichs para un problema de Riemann", loc="center")
ax.legend(loc="best")

U1 = U(x=x)


def init():
    ln.set_data(x, U(x))
    ln1.set_offsets(offsets=np.column_stack([x, U1]))

    return (ln,)


def update(frame):
    ln1.set_offsets(offsets=np.column_stack([x, U1]))
    ln.set_data(x, U(x=x - c * frame * Δt))
    U1[1:-1] = (
        0.5 * (np.roll(U1, -1) + np.roll(U1, 1))[1:-1]
        - 0.5 * cfl * (np.roll(U1, -1) - np.roll(U1, 1))[1:-1]
    )
    ax.set_ylabel(
        ylabel=rf"$U\left(x, t={frame * Δt:.2f}\right)$", loc="top", rotation=0
    )

    return (ln,)


anim = FuncAnimation(
    fig=fig,
    func=update,
    frames=tqdm(iterable=range(t.size), file=sys.stdout, colour="green"),
    interval=1,
    init_func=init,
    blit=True,
).save(
    filename="lax-friedrichsheaviside.gif",
    writer=FFMpegWriter(
        fps=90,
        codec="libx265",
        metadata={
            "subject": "Numerical Analysis",
            "title": "Exact solution",
            "author": "Gloria Almozara Sainz",
            "genre": "Mathematics",
            "copyright": "2025",
            "srcform": "Matplotlib 3.9.3",
            "comment": "Numerical Simulation for advection PDE",
        },
    ),
    dpi=300,
    savefig_kwargs={"transparent": True, "facecolor": "none"},
)
plt.close()
Loading...
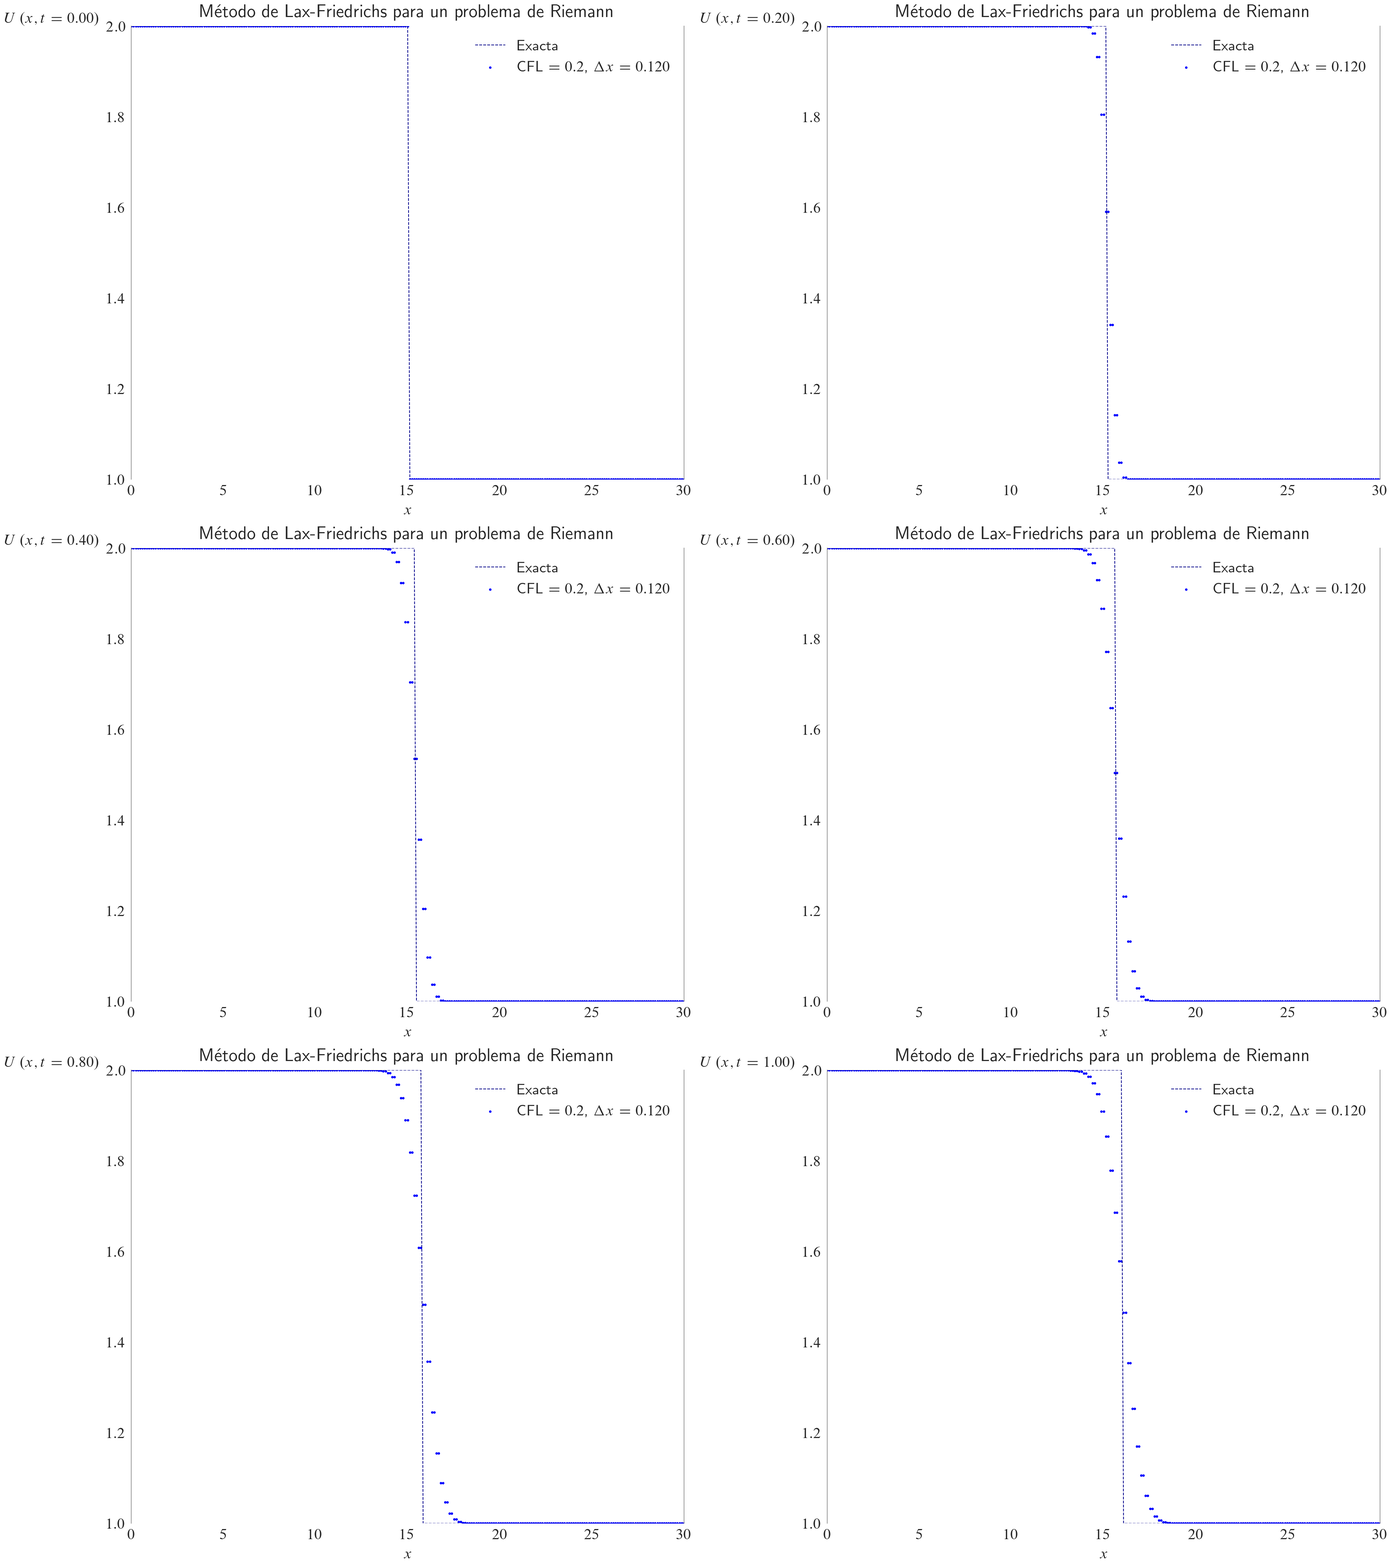
fig, ax = plt.subplots(layout="constrained")

(ln,) = ax.plot(
    [],
    [],
    color="DarkBlue",
    label="Exacta",
    linestyle="dashed",
    linewidth=0.5,
)
ln1 = ax.scatter(
    x=[],
    y=[],
    c="blue",
    label=rf"CFL $={cfl:.1f}$, $\Delta x={Δx:.3f}$",
    s=0.4,
)
ax.spines["bottom"].set_color("none")
ax.spines["top"].set_color("none")
ax.spines["left"].set_alpha(alpha=0.8)
ax.spines["left"].set_edgecolor(color="gray")
ax.spines["left"].set_linewidth(w=0.5)
ax.spines["right"].set_alpha(alpha=0.8)
ax.spines["right"].set_edgecolor(color="gray")
ax.spines["right"].set_linewidth(w=0.5)
ax.set_xlabel(xlabel=r"$x$")
ax.set_xlim(left=x[0], right=x[-1])
ax.set_ylim(bottom=U(x).min() - 0.01, top=U(x).max() + 0.01)
ax.set_title(label="Método de Lax-Wendroff para un problema de Riemann", loc="center")
ax.legend(loc="best")

U1 = U(x=x)


def init():
    ln.set_data(x, U(x))
    ln1.set_offsets(offsets=np.column_stack([x, U1]))

    return (ln,)


def update(frame):
    ln1.set_offsets(offsets=np.column_stack([x, U1]))
    ln.set_data(x, U(x=x - c * frame * Δt))
    U1[1:-1] -= (
        0.5 * cfl * (np.roll(U1, -1) - np.roll(U1, 1))[1:-1]
        - 0.5 * cfl**2 * (np.roll(U1, -1) - 2 * U1 + np.roll(U1, 1))[1:-1]
    )
    ax.set_ylabel(
        ylabel=rf"$U\left(x, t={frame * Δt:.2f}\right)$", loc="top", rotation=0
    )

    return (ln,)


anim = FuncAnimation(
    fig=fig,
    func=update,
    frames=tqdm(iterable=range(t.size), file=sys.stdout, colour="green"),
    interval=1,
    init_func=init,
    blit=True,
).save(
    filename="lax-wendroffheaviside.gif",
    writer=FFMpegWriter(
        fps=90,
        codec="libx265",
        metadata={
            "subject": "Numerical Analysis",
            "title": "Exact solution",
            "author": "Gloria Almozara Sainz",
            "genre": "Mathematics",
            "copyright": "2025",
            "srcform": "Matplotlib 3.9.3",
            "comment": "Numerical Simulation for advection PDE",
        },
    ),
    dpi=300,
    savefig_kwargs={"transparent": True, "facecolor": "none"},
)
plt.close()
Loading...
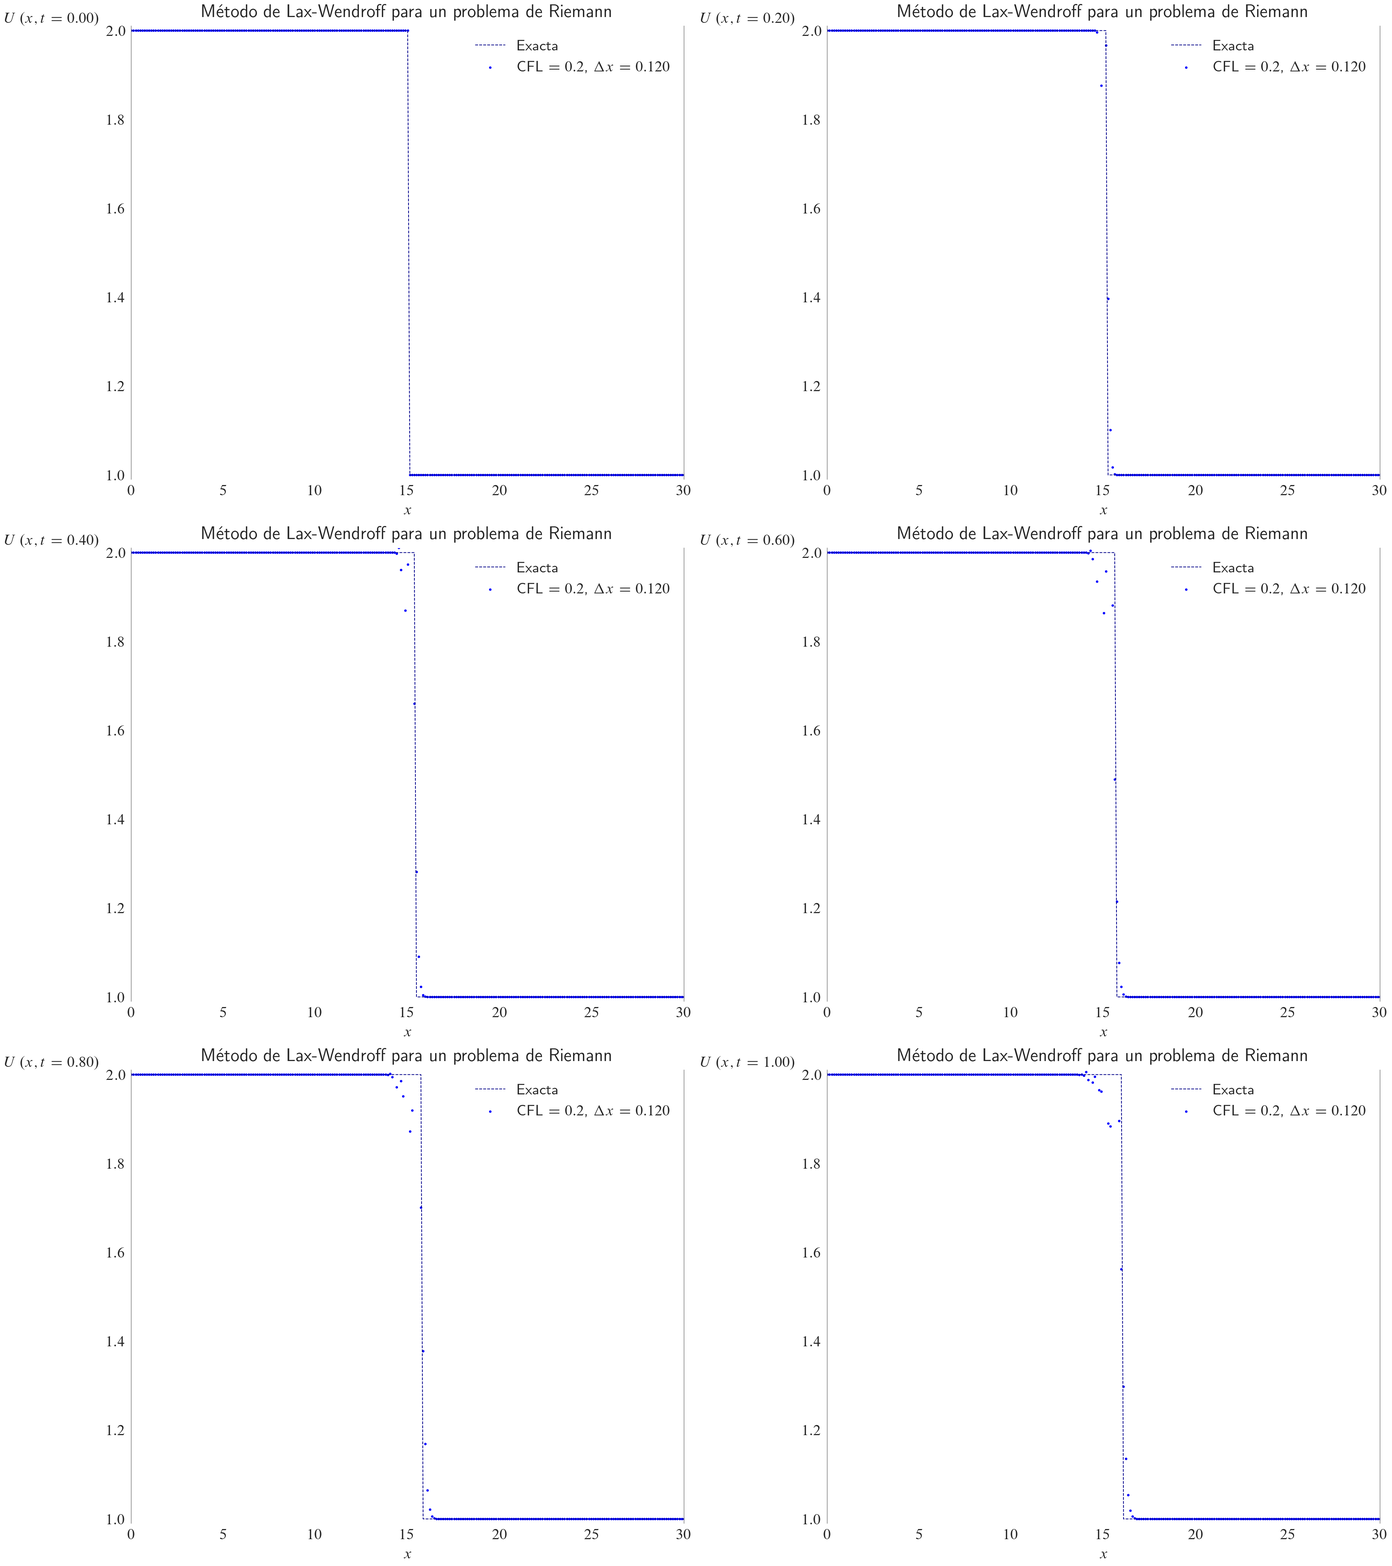
x, Δx = np.linspace(start=0, stop=1, num=41, retstep=True)
t, Δt = np.linspace(start=0, stop=0.15, num=301, retstep=True)
def U(x):
return np.exp(-np.power(x - 15, 2))def V(x):
return np.exp(-np.power(x - 15, 2)) + 2fig, ax = plt.subplots(layout="constrained")
ax.plot(
x,
U(x),
color="red",
label=r"$U_{0}\left(x\right)$",
linestyle="solid",
linewidth=1.0,
)
ax.plot(
x,
V(x),
color="red",
label=r"$V_{0}\left(x\right)$",
linestyle="solid",
linewidth=1.0,
)
ax.spines["bottom"].set_color("none")
ax.spines["top"].set_alpha(alpha=0.8)
ax.spines["top"].set_edgecolor(color="gray")
ax.spines["top"].set_linewidth(w=0.5)
ax.spines["left"].set_alpha(alpha=0.8)
ax.spines["left"].set_edgecolor(color="gray")
ax.spines["left"].set_linewidth(w=0.5)
ax.spines["right"].set_alpha(alpha=0.8)
ax.spines["right"].set_edgecolor(color="gray")
ax.spines["right"].set_linewidth(w=0.5)
# ax.set_xlim(left=x[0], right=x[-1])
# ax.set_ylim(bottom=0, top=1)
ax.set_title(
label=r"Condición inicial $U_{0}\left(x\right)=e^{-{\left(x-15\right)}^{2}}$",
loc="center",
)
ax.legend(loc="best")Loading...